CONTENTS: This section on Transects is composed of Several Parts:
1. This Page with background and some ideas.
2. Why do Transects.. overview and Techniques.
3. For a more in depth exercise on the Ecological Niche of organisms see this file: Ecological niche, The Empirical Model
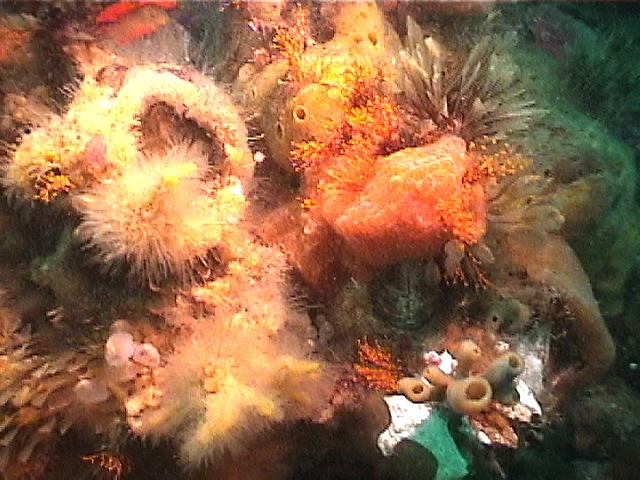
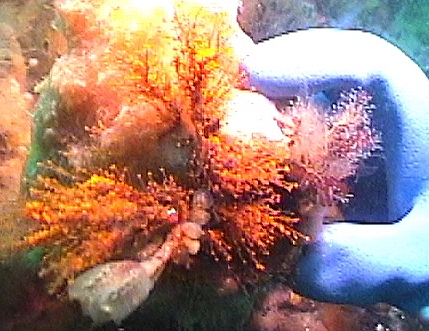
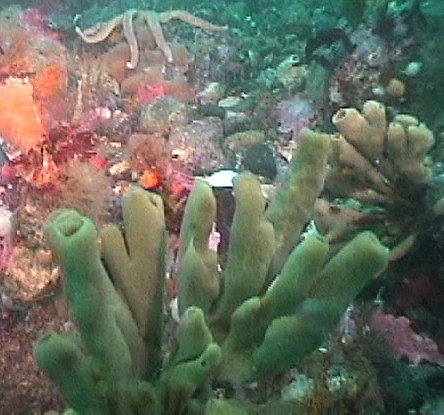
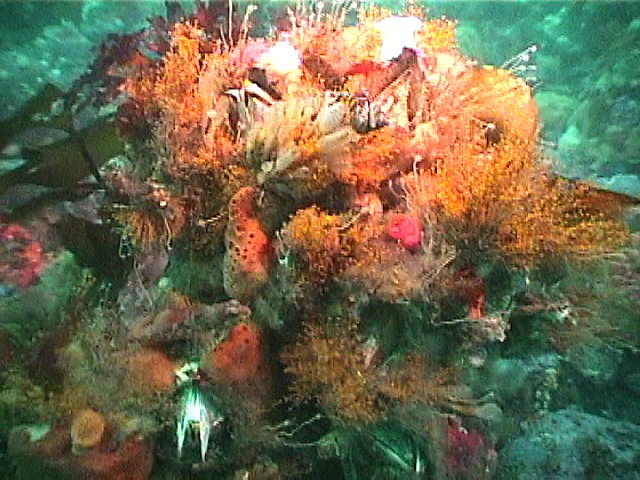
4.See the following completed photographic transects:
See Transect A0050101
See Transect A0050102
See Transect A0050103
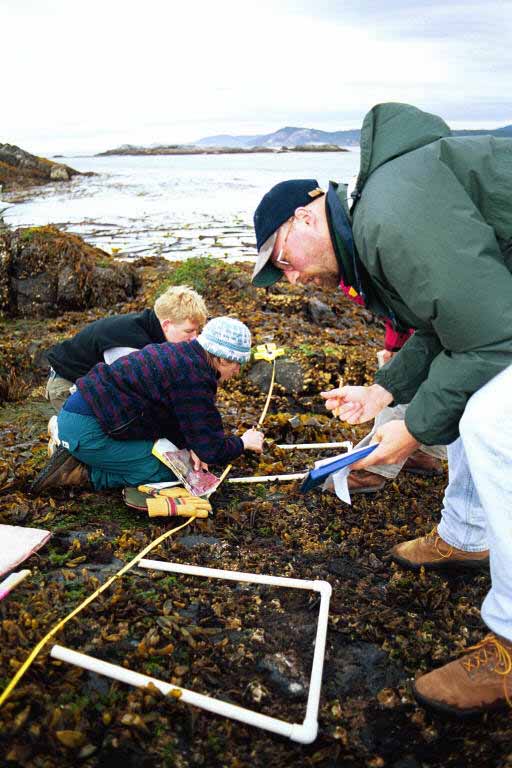
BACKGROUND
The students and faculty of Lester B. Pearson College which is a member of the United World Colleges have used the ecological reserve and now the MPA of Race Rocks for studies of marine ecosystems, both sub-tidally and inter-tidally since1978. During that time a number of exercises have been developed to use in teaching ecological concepts in the International Baccalaureate Environmental Systems and Biology classes.
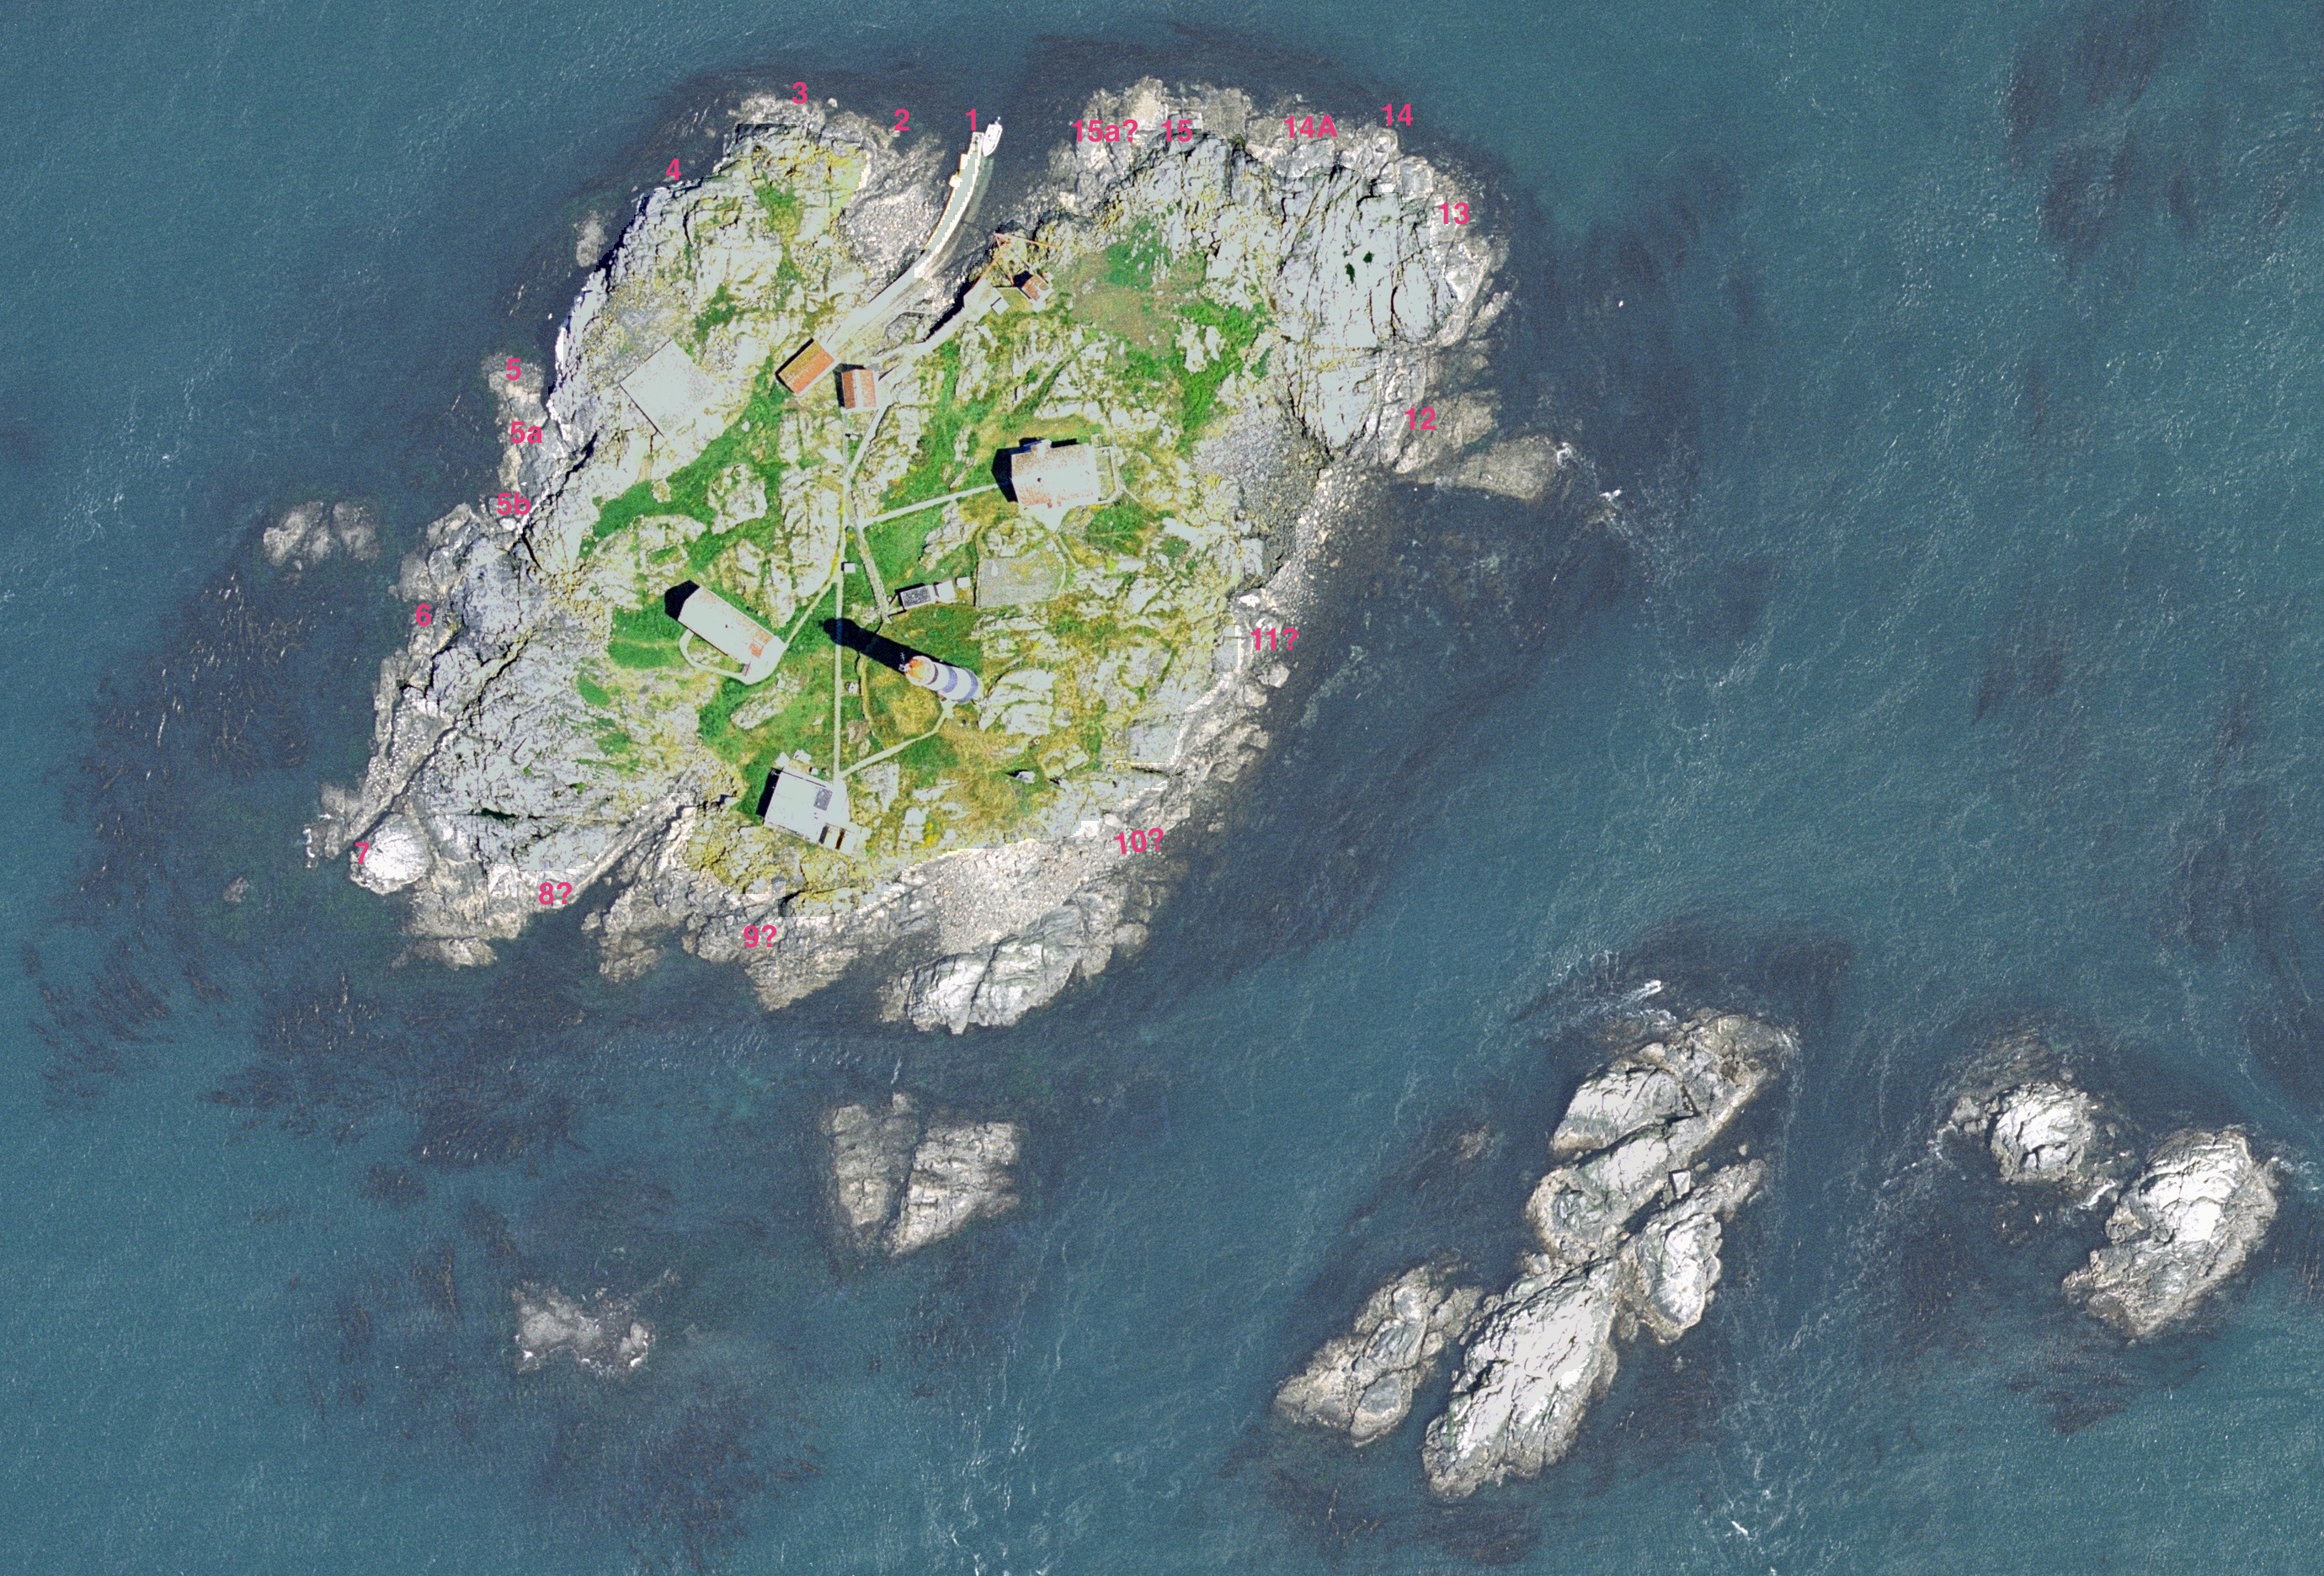
Transect Peg Locations on Race Rocks
Carmen’s Lab on Transects – kite Diagrams
1998 Class Photos and – Transects of Peg #`15
1999- Royal Roads Environmental management students visit Race Rocks
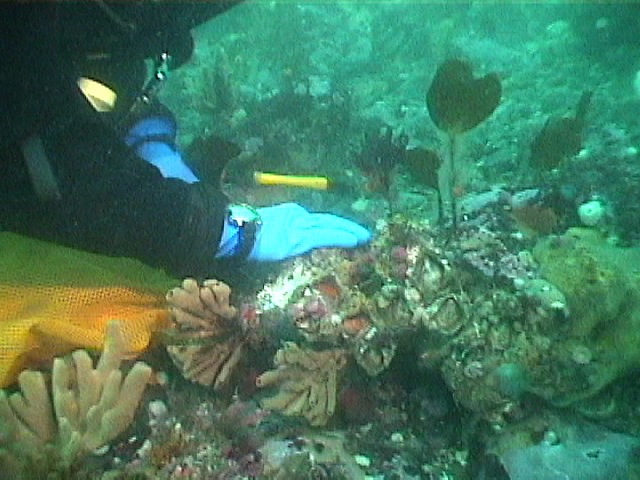
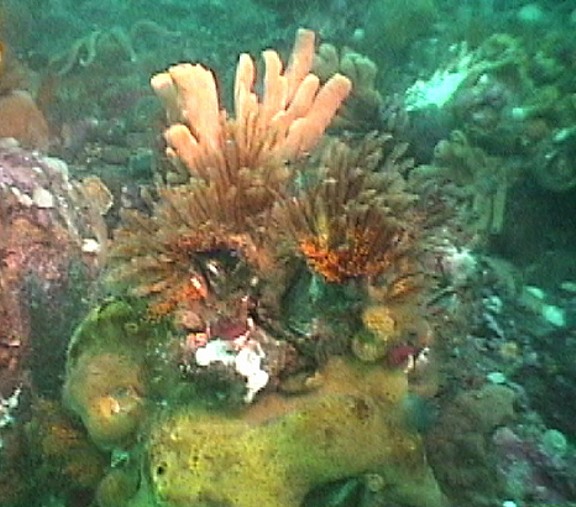
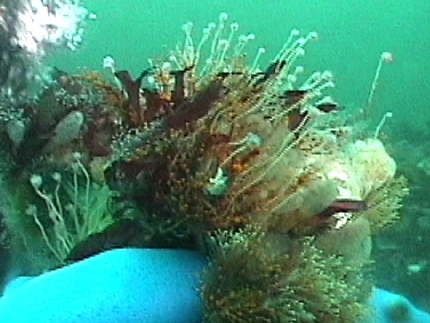
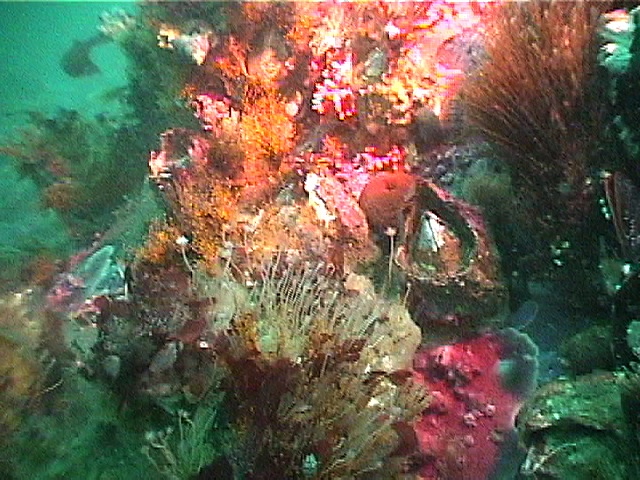
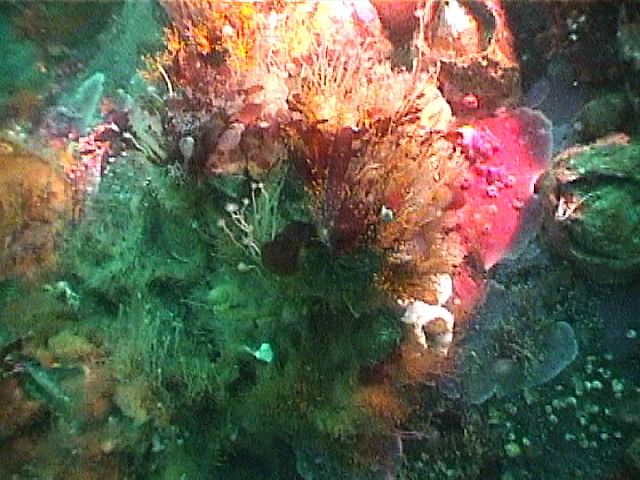
Underwater Transect at Race Rocks -Video
While using basic research techniques it has been possible to start to build up a library of information that can be more useful for determination of the effects of long term climatic changes or changes induced by humans, (anthropogenic). In addition this record may provide ideas to encourage others to apply the techniques to other ecosystems.
This program was developed at the 1995 BioQUEST Summer Workshop on Collaborative Learning, Peer Review, and Persuasion in Biology Education at Beloit College, WI. USA
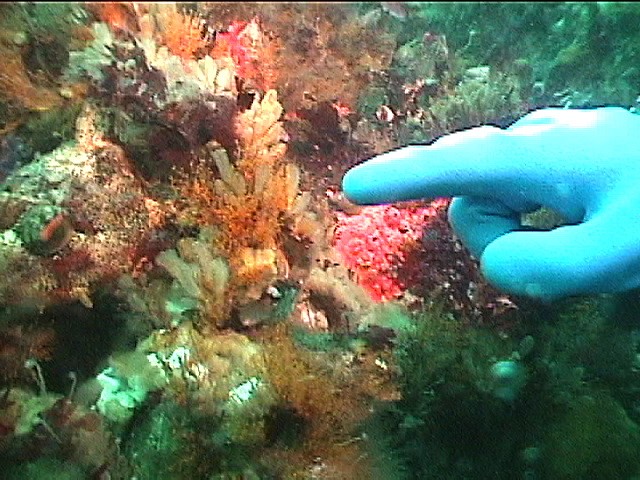
See the following completed photographic transects:
See Transect A0050101
See Transect A0050102
See Transect A0050103
NUMBERING SYSTEM
A numbering system had to be developed that reflected the concept that this was only one of many that could be referenced from this site if individuals from around the world were willing to collaborate with us in building the project.
LOCATION….PEG NUMBER…TRANSECT NUMBER….QUADRAT NUMBER..
A0……..05…………01…………01………
Where:
| A0 |
refers to the first site to be added to this WWW site |
| 05 |
refers to the peg location ( we have 15 such locations permanently identified at the Race Rocks Ecological Reserve.) |
| 01 |
refers to the first transect entered from this location. |
| 01 |
refers to the first quadrat picture that you can access on this photographic strip. |
TIDAL LEVELS
Since the location of organisms in the intertidal zone is partially determined by tidal levels, that is one of the essential measurements given with our transect images. It is important to understand that the levels given here are based on the Canadian tide tables
Victoria Tide TablesThese are not calculated the same way as tables from the United States. To convert the elevations given here to conform to the US pattern in which 0.0 equals mean lower low water, subtract 0.8 meters from these Canadian readings.You may find further explanation on the operation of Tides in any marine biology or Oceanography text. One that may be useful is:
Seashore Life of the Northern Pacific Coast– by Eugene Kozloff, page 7-9.
For TIDAL Heights of Other LOCATIONS, use this link
SOME IDEAS FOR USE OF THESE TRANSECT PHOTOS
- Quantify the distribution of organisms
- Relate the distribution to the intertidal elevation
- Find out how to capture these images
- Use other technology to analyze the photos
- Study the mussels in greater depth
- Study other organisms from the transects in greater depth.
- Students in environmental systems will use this as a source to prepare for investigations in the intertidal zone when we have the opportunity to do a field lab at the ecological reserve. The photo strips also could be used by those living far from an ocean shore to study the relationship between abiotic or physical factors and organism distribution. Also by noting the location of certain species, for instance the mussels, M. californianus and then seeing where they would fit on a tidal level chart for the area (using the Victoria Tide Tables), students could calculate the length of times for submergence and emergence of the species in a week, a month, or a year. In addition they could compare the conditions in the winter months, with the extreme low tides occurring in the night with the conditions in the summer months when the low tides occur every two weeks in the daytime. Students should be encouraged to discuss the results of their investigations and pose further questions about conditions in the intertidal zone.
See Transect A0050101
See Transect A0050102
See Transect A0050103
THIS IS JUST A START!
By looking here you might get a few ideas of how you can do some interesting investigations using these pictures. But don’t stop there, we would like you to collaborate with us by adding ideas and new transects to our list. It would be excellent if someone living on another ocean shore with different intertidal zonation patterns could supply a similar set of photographs for comparison.Go back to techniques for directions on how to contribute