March 4 and 5

Wind: yesterday 2-42 knots variable directions, today 0-31 knots from N in am and W in pm
Sea State: yesterday chop up to 1 m, today rippled then up to 1 m chop in afternoon
Visibility: yesterday 10 NM, today 5-15 NM
Sky: yesterday clear, today partly cloudy and rain in afternoon
Temperature: yesterday 5-10 °C, today 5-9 °C
Atmospheric CO2: 413.05 ppm (recorded by NOAA at Mauna Loa Observatory, Hawaii)

The tide has been getting low in the evenings over the past two days, revealing lots of neat intertidal creatures. With no sea lions hanging out on the east side of the island, I was able to explore the rocky shoreline to see feather duster worms, sea stars, barnacles, surf grass, many types of seaweeds and long ago discarded metal pieces from former buildings and equipment at the lightstation that only reveal themselves at low tide.

There are six very stationary elephant seals on the island: one adult female, two adult males, two female pups and one male pup.

Today, I drained the cistern which stores the seawater before it gets treated by the desalinator. The cistern is a large concrete box located between the lighthouse and the main residence. It measures 12 m long by 8 m wide by 3 m deep. It holds a lot of water. The water was slightly turbid and causing the desalinator pre-filters to work harder than needed. The water pump ran for four hours to drain the many thousands of litres of water back into the ocean. I used a long pressure washing wand to reach in to clean the rocks on the bottom and concrete walls, at least the parts I could reach. Tomorrow, I will refill the cistern when the tide is higher and the intake hose can be put off the end of the jetty.

Yesterday morning, six visitors came to the island: Travis, Hilary, Antoine, Hannah, Val and Greg. There was one tour boat that passed by. Today, two tour boats were in the ecological reserve in the morning.

Groundhog Day

Wind: yesterday 0-52 knots from S to W, today 0-18 knots from W to NE
Sea State: yesterday rippled with waves up to 1 m in afternoon and evening, today rippled
Visibility: yesterday 5-10 NM, today 15 NM
Sky: yesterday rain then patches of sun, today clear
Temperature: yesterday 5-12 °C, today 3-5 °C
Atmospheric CO2: 414.49 ppm (recorded by NOAA at Mauna Loa Observatory, Hawaii)

This morning at sunrise, the elephant seals saw their shadows. As the lore goes for their fellow mammal the groundhog, that means six more weeks of winter. Hard to believe with the crocuses blooming and daffodils buds almost ready to burst. Although, there is snow in the forecast for tonight and tomorrow as the temperature drops to 0 °C.

There were no visitors to the island. Two eco tour boats were seen in the reserve this afternoon.

Here are the results for the weekly census, conducted in the afternoon of Sunday, February 2:
10 elephant seals (3 female adults, 4 male adults, 1 female pup, 1 male pup and 1 unknown gendered pup)
147 steller sea lions
288 california sea lions
104 harbour seals
10 bald eagles (5 adults, 5 juveniles)
1 raven
109 brandt’s cormorants
182 pelagic cormorants
49 double-crested cormorants
24 canada geese
931 gulls (most are thayer’s gulls)
18 black oystercatchers
1 whimbrel
1 surf scoter
8 harlequin ducks
16 black turnstones
1 snow bunting
1 fox sparrow

Stormy Sunday

Wind: 3-52 knots swinging around from SW yesterday in every direction to NW this evening
Sea State: up to 4 m waves
Visibility: 5-15 NM
Sky: overcast with rain and some sunny patches
Temperature: 5-8 °C
Atmospheric CO2: 413.65 ppm (recorded by NOAA at Mauna Loa Observatory, Hawaii)

It has continued be very windy over the past two days, whipping up big waves from the west. Today, the wind reached a top speed of 54 knots or 100 km/h, which on the Beaufort Wind Scale is force 10, corresponding to a storm. The two higher forces on the scale are 11 (56-62 knots violent storm) and 12 (64-71 knots hurricane). See the photos and videos below for some windy and wavy views.

The wind cleared off the South Seal Rocks of its usual inhabitants of steller sea lions. They were floating in sea lion rafts and surfing the waves for most of the day. When the wind died down a bit in the late afternoon, I walked in the intertidal zone which at low tide connects the main island with the closest of the South Seal Rocks. I hadn’t been able to walk around there in the past two weeks I have been here, due to the hauled out sea lions. It was great to see the main island from the perspective of a sea lion. On my walk around, I found some intertidal trash, some of which has been there for a while. See the photos below for some of my finds.

On Monday, there is a planned visit from some electricians and technicians to do some work on the desalinator and energy system. These will be the first visitors in a week and a half. If all goes according to plan, the desalinator will be operational by early afternoon and pumping water into the tank.

During my time here in the past two weeks, I have used 800 L of water, according to the gauge on the water tank as well as the three consumed drinking water jugs. While I’m conscious of my water use, I still do all the normal tasks like cooking, drinking lots of tea, washing dishes, showering and doing laundry. As a comparison, the 2018 average day per capita water use in Vancouver, BC was 444 L. I’m doing all right!

Video: A panoramic view of the whole island and waves as seen from helicopter pad. The sound is quite loud due to the strong wind.

Video: Watching hail on the window from the comfort of inside the house, while the elephant seal neighbours brave the elements outside. It hailed three times today.

The Grand Sailboat Regatta

Weather

  • Visibility: 8 miles in the early morning, 15 later on
  • Wind: 15-20 knots East, then North, then West
  • Sky: foggy and overcast, then sunny, then overcast
  • Scattered raindrops throughout the day
  • Water: mostly calm, with swells in the afternoon

DSC_6437

Ecological

  • Maya and Tazi conducted 4 intertidal transects today.
  • Studying an intertidal transect involves measuring out a certain distance from a peg, and then documenting the different species found every 0.5 metre.
  • In some transects the 0.5 metres are measured by water elevation; in others simply by distance.
  • By comparing the species found in every zone of the transect with transect data from previous decades, you can see the change in intertidal ecosystems due to climate change.
  • We saw a California Sea Lion with the brand U374 and another with a tracker.
  • While most of the gull eggs all look the same, one particular egg is quite different.

Maintenance

  • Maya and I ran the fire pump in the morning.
  • This added a few inches to the cistern.
  • We removed the old Canadian flag and hoisted a fresh one.
  • Tazi and I removed some algae.
  • Ali whacked away at the thistles.
  • We cleaned the solar panels.

Boats

  • Over 150 sailboats from Victoria passed by Race Rocks in the late morning on their way towards the Western horizon.
  • Some of them started to return as late as 22:30.
  • The colours of their sales included: red, blue, white, fluorescent yellow, green, purple, black, orange, and many combinations of all of the above.
  • Some standouts included the Miles Davis sail and the Union Jack.
  • I couldn’t stop taking photos and ended up with dozens. Below is a selection of the best.
  • One coastguard zodiac and a search and rescue boat appeared to be accompanying the sailboats.
  • Several eco-tours came by, including one Eagle Wings tour that drove through the South Channel.
  • Passing through the South Channel is prohibited as the width is too narrow.

A Windy Census

Weather

  • Visibility: 15 miles
  • Wind: 20-25 knots West in the morning, picking up to 30-35 by noon.
  • Sky: overcast
  • Water: 3′ chop

DSC_6368

Ecological

  • I oversaw an enthusiastic day long census with Maya, Tazi, and Ali.
  • Discovered a new Black Oystercatcher nest with 3 eggs!
  • Maya and Tazi discovered a new Canada Goose nest.
  • I begin to suspect that our new elephant seal male is actually Chuckles.
  • If he did nothing but eat for 3 months straight, that would explain his girth.
  • Saw a Steller Sea Lion branded 9628.
  • We found a blood star, and Maya showed us various chitons.
  • Maya and Tazi did a transect.
  1. Harbour Seals: 190
  2. California Sea Lions: 42
  3. Steller/Northern Sea Lions: 39
  4. Elephant Seals: 15 (13 on Great Race, 2 in the Southern waters)
  5. Seagulls: 225 (Glaucous-winged)
  6. Pigeon Guillemots: 82
  7. Canada Geese: 36 (14 on Great Race, 22 flyovers)
  8. Black Oystercatchers: 8 (plus 2 nests with a total 5 eggs)
  9. Harlequin Ducks: 3 (2 male, 1 female)
  10. Cormorants: 3
  11. Barn Swallows: 2

Maintenance

  • We cleaned the solar panels.
  • Finished cleaning the boathouse floor with T.S.P.
  • Repainted some rusty propane tanks.
  • Sanded the westward facing bench by the Students’ house.

Boats

  • Several eco-tours came by in the morning, but as wind picked up they disappeared.

Transect Peg Locations on Great Race Rocks

Expand this map of Great Race Rocks in order to see the numbered pegs in red around the shoreline. Some of these pegs were intended as intertidal locators, and some as subtidal tethering pegs. The ones with question marks still need to be located to be sure.

Some of the  pegs were established pre-1980 and some were established after 2000.

centrelargeandislepegs
Peg 1: off west side of jetty end- subtidal
Peg 2: off point of bay west of jetty–subtidal
peg 3: further along north side– subtidal
peg 4: off base of cliff– subtidal (proved impractical because of high current)
peg 5: inter and subtidal
peg 5a:later installation- inter and subtidal
peg 5b: later installation-inter and subtidal
peg 6: for tidepool locator and intertidal and subtidal
peg 7: for subtidal minimal use
peg 8: for subtidal not used
peg 9: for subtidal not used
peg 9 : for subtidal not used
peg 10: for subtidal not used
peg 11: subtidal not used as too close to old outfall.
peg 12 inter and subtidal
peg 13: used for annual intertidal algae stratification lab exercise.
peg 14: subtidal- outer extreme North East corner.
peg 14b: inter and subtidal concrete mound with stainless steel hole for peg – inter and subtidal
peg 15: large boat mooring post — used for intertidal lab exercises
peg 15a: inter and subtidal concrete mound with stainless steel hole for peg – inter and subtidal

From peg 5 and 5a:
See Transect A0050101
See Transect A0050102
See Transect A0050103

___________________________________________________________

Return to the Contents page for Environmental modelling with Transects..

Bald Eagle versus Canada Goose

Today’s weather was a mixed bag. Early on there was thick fog, which thinned by dawn and cleared in the early morning. Then for a short time it was glorious and fairly calm with winds westerly up to 15 knots. The westerly wind doubled in the early afternoon and by 4:00 PM it was gusting well over 35 knots in the tower. On radio watch for the afternoon’s activities, I kept a weather eye on Pearson College sailing vessel Amatuana as she was blown across to Victoria in no time flat. Nicely done.

Only one whale watching boat was noted in the Ecological Reserve today and when I finally spotted them, they were pounding out through wind and tide towards Race Passage. Their sound alerted me to their presence.

The Northern Elephant Seals are starting to moult and data collection on basic biological parameters began today including non-invasive, length measurements using the marine railway as a big meter stick.


If only this female were lying next to a big ruler, we would have a complete data set on her for April 17, 2015.

If only this female were lying next to a big ruler, we would have a complete data set on her for April 17, 2015.

There were 14 visitors first thing this morning. Courtney, driving Second Nature, brought out one of Laura’s first year, marine science classes. It was an early start for these  students but they had breakfast en route and were very efficient on shore. They did a quantitative, community ecology activity on the low tide. They were trying to determine if and how the diversity, abundance and distribution of intertidal macro-biota changed with vertical height. They used water levels to measure vertical height, (an ancient Egyptian leveling technique based on the fact that water will always find its’ own level), transect lines to position sampling and quadrats to focus sampling efforts. These photos of the students, were all taken by Laura Verhegge.

First year marine science students from around the world learn science experientially at Lester B. Pearson College of the Pacific.

First year marine science students from around the world learn science experientially at Lester B. Pearson College of the Pacific.

Catriona and Claudia demonstrate skill and teamwork using the waterlevel to measure vertical height ti the next sample.

Catriona and Claudia demonstrate skill and teamwork using the water-level to measure vertical height to the next sample.


tella, Connor and Tamara discover the intricacies of inter-tidal life.

Stella, Connor and Tamara discover the intricacies of inter-tidal life.

Courtney is a big fan of elephant seals and so she was keen to help with the first elephant seal measurements this morning and assisted in working out a way for one person to measure the elephant seals without disturbing them. As of this afternoon the marine railway is the new ruler and first measurements made of a young male were very close to those made earlier with a laser, measuring device. The laser technique required two people, two long boards, a right angle check and eye safety protocols. The laser technique had potential to bother the animal (if it was awake). The new technique is passive, non-invasive and non-threatening.


Male elephant seal entering the "measuring device".

Male elephant seal entering the “measuring device”.

I saw a juvenile Bald Eagle attack a goose sitting on her nest today. I had suspected this was going on but good to verify. The eagle might have been successful with back-up, but the gander flew in and together with the goose, drove the eagle off. You can guess who I was cheering for. I know it is not science but there is no hockey out here and I am Canadian, eh.


Ecological Niche -the Empirical Model

Return to the Contents page for Environmental modelling with Transects..

BACKGROUND HISTORICAL TREATMENT of the ECOLOGICAL NICHE
Joseph Grinnell 1917 the habitats and habits of birds
Charles Elton 1927 the species’ place in the biological environment, its relationship to food and predators.
G.F. Gause 1934 the intensity of competition between species suggest the degree to which their niches overlapped
David Lack 1947 realized that niche relationships could provide a basis for evolutionary diversification of species
G.E.Hutchinson 1959 was the first to define the niche concept formally as the activity range of each species along every dimension of the environment.

G. E. Hutchinson on the Niche Concept:  In 1957, in a paper entitled “the Niche Concept by G. E. Hutchinson defined the niche concept formally. One could describe the activity range along every dimension of the environment. Physical and chemical factors such as temperature, humidity, salinity, and oxygen concentration, and biological factors such as prey species and resting background against which an individual may escape detection by predators, could be determined. Each of these dimensions could be thought of as one of n-dimensions in space. Visualizing a space with more than three dimensions is difficult, since the concept of the n-dimensional niche is an abstraction. We may, however, deal with multi-dimensional concepts mathematically and statistically, depicting their essence by physical or graphical representations in three or fewer dimensions.

Ricklefs (1996) notes that “… for example, a graph relating biological activity to a single environmental gradient represents the distribution of a species’ activity along one niche dimension. The level of activity, whether oxygen metabolism as a function of temperature or consumption rate as function of prey size, conveys the ability of an individual to exploit resources in a particular part of the niche space and, conversely, the degree to which the environment can support the population of that species. In two dimensions the individuals niche may be depicted as a hill, with contours representing the various levels of biological activity. In three dimensions, we must think of a cloud in space whose density conveys niche utilization. Beyond three the mind boggles.”

Please see Hutchinson, R.E. 1957. Concluding remarks. Cold Spring Harbor. Symp. Quant. Biol. 22: 415-427.
Paraphrased from Ecology by R. E. Ricklefs 1996.
Hutchinson was the first to formally quantify the niche concept in terms of geometric space. For example, suppose the distribution of a given species of tree squirrel is determined primarily by 3 variables: branch diameter, acorn size and temperature. The “level of activity” describes the ability of the individual to exploit the resources in a given part of the niche space; in this case, number of squirrels foraging for a given level of each environmental factor. Then the niche space occupied by the species is the 3-dimensional space actually occupied by all individuals (Ricklefs 1996). This can be represented graphically as a contour plot.
An empirical model ( Box and Draper 1989) can be obtained by the empirical determination of “niche occupancy” (e.g. density, number of individuals, etc.) in terms of n environmental variables (these may be both biotic and abiotic). This model may be formalized as a second-order polynomial equation; the eigenvalues calculated from the matrix of coefficients of cross-product terms formally quantify the response surface in the area of the optimum response. The simultaneous evaluation of multiple variables is important in biological systems where optimum responses usually consist of a range of values rather than a single point.

THE EXERCISE
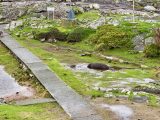
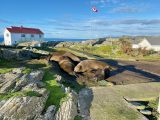
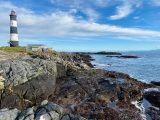
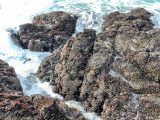
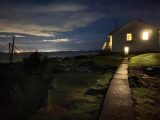
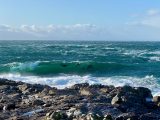
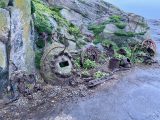
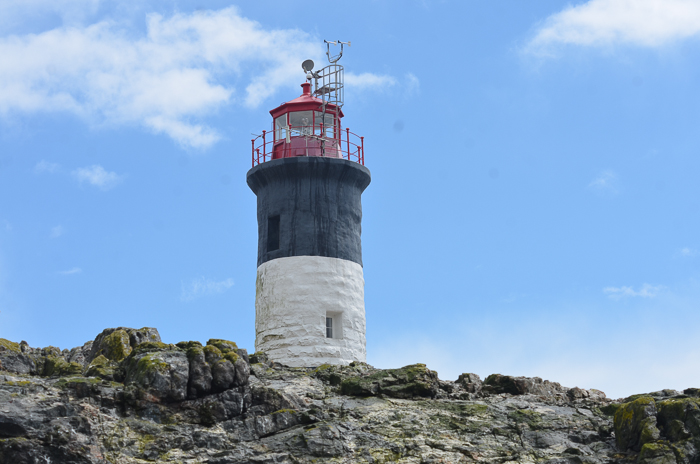
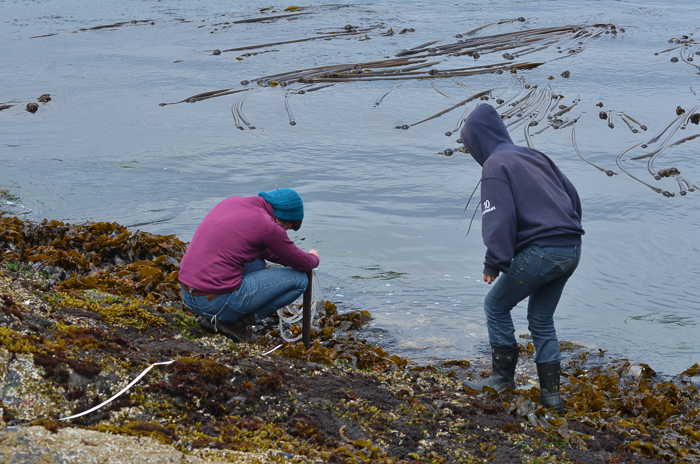
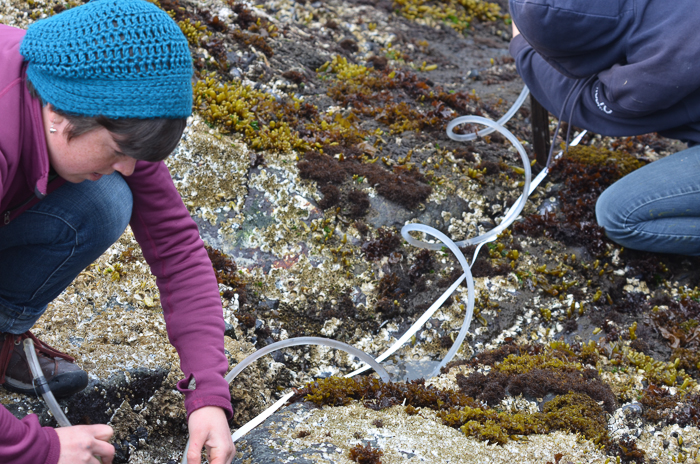
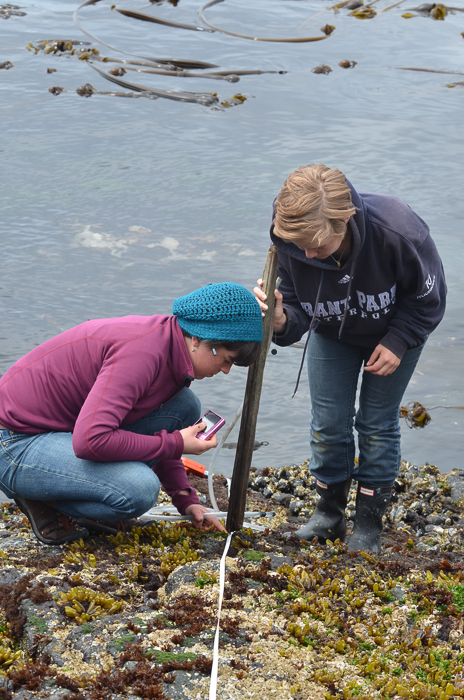
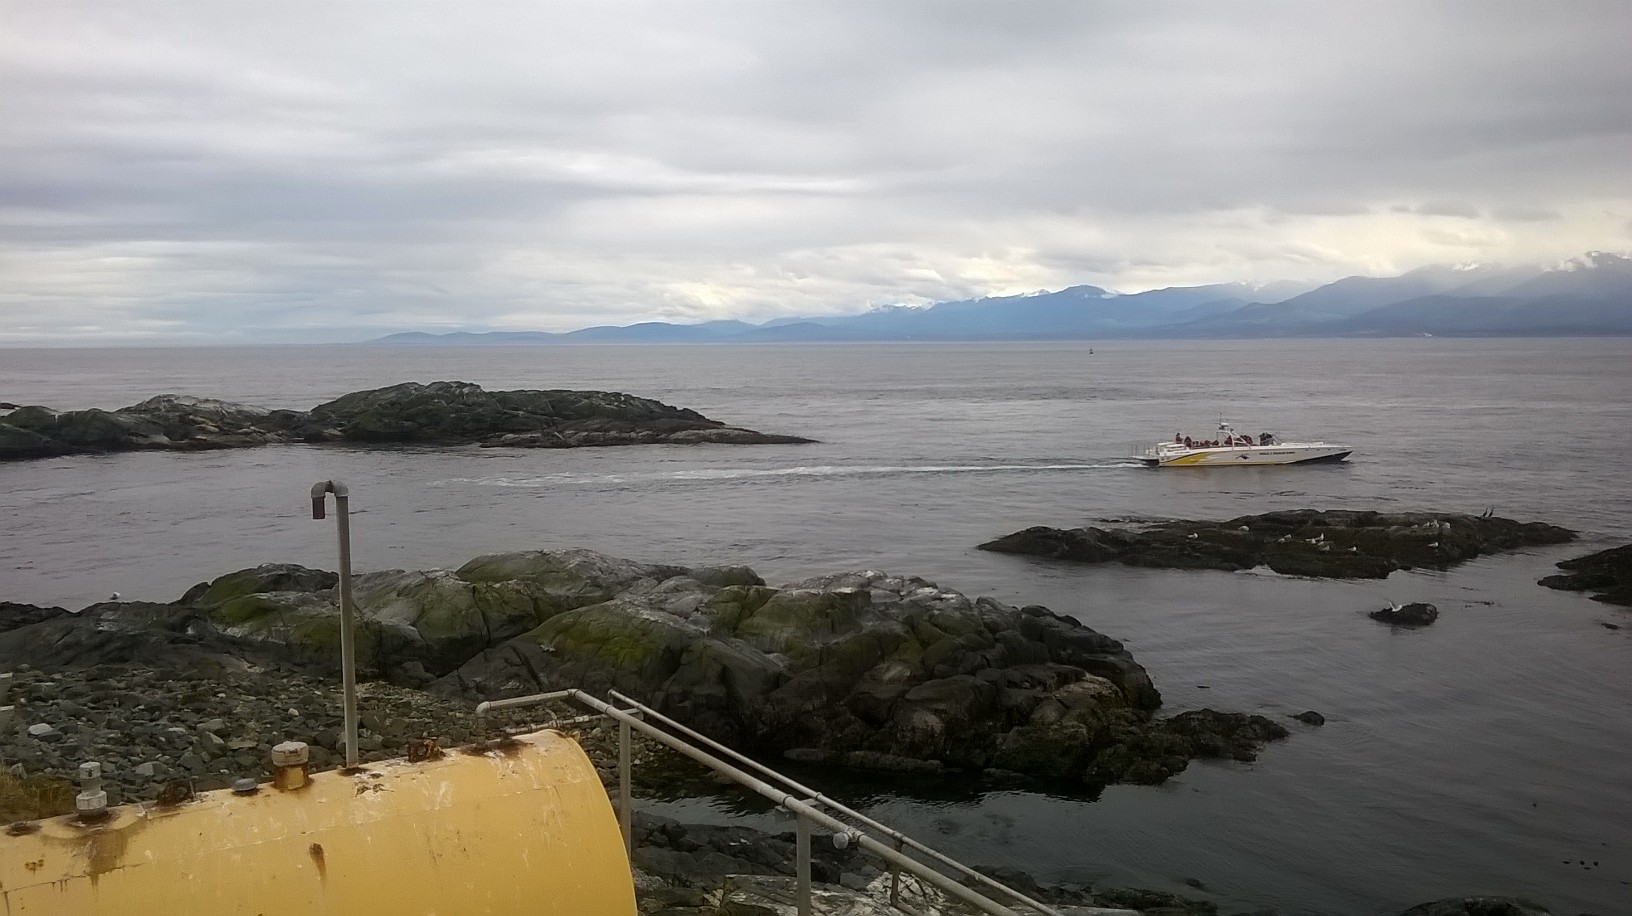
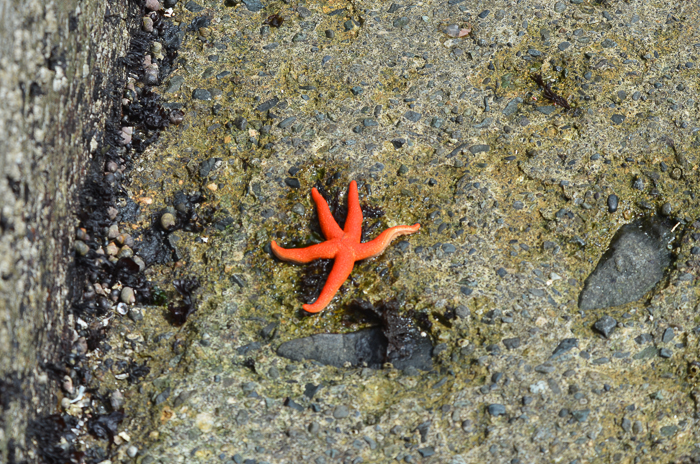
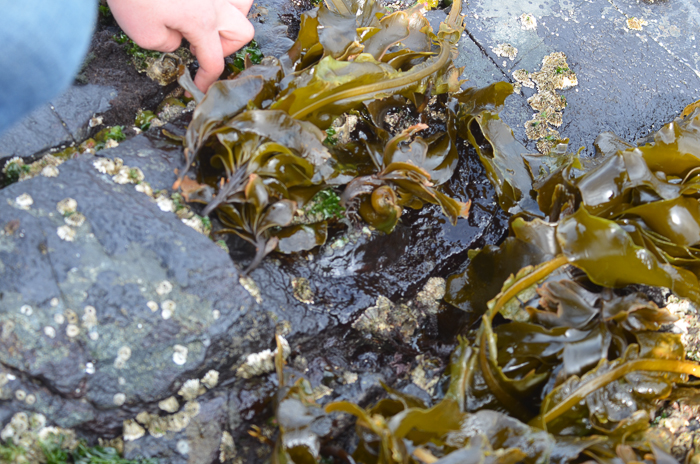
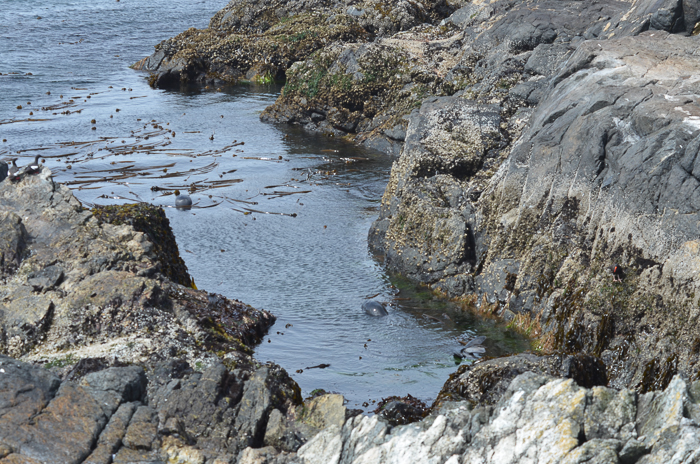
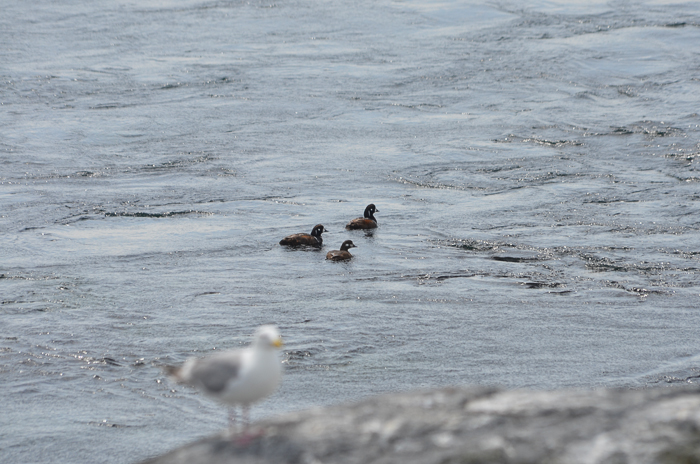
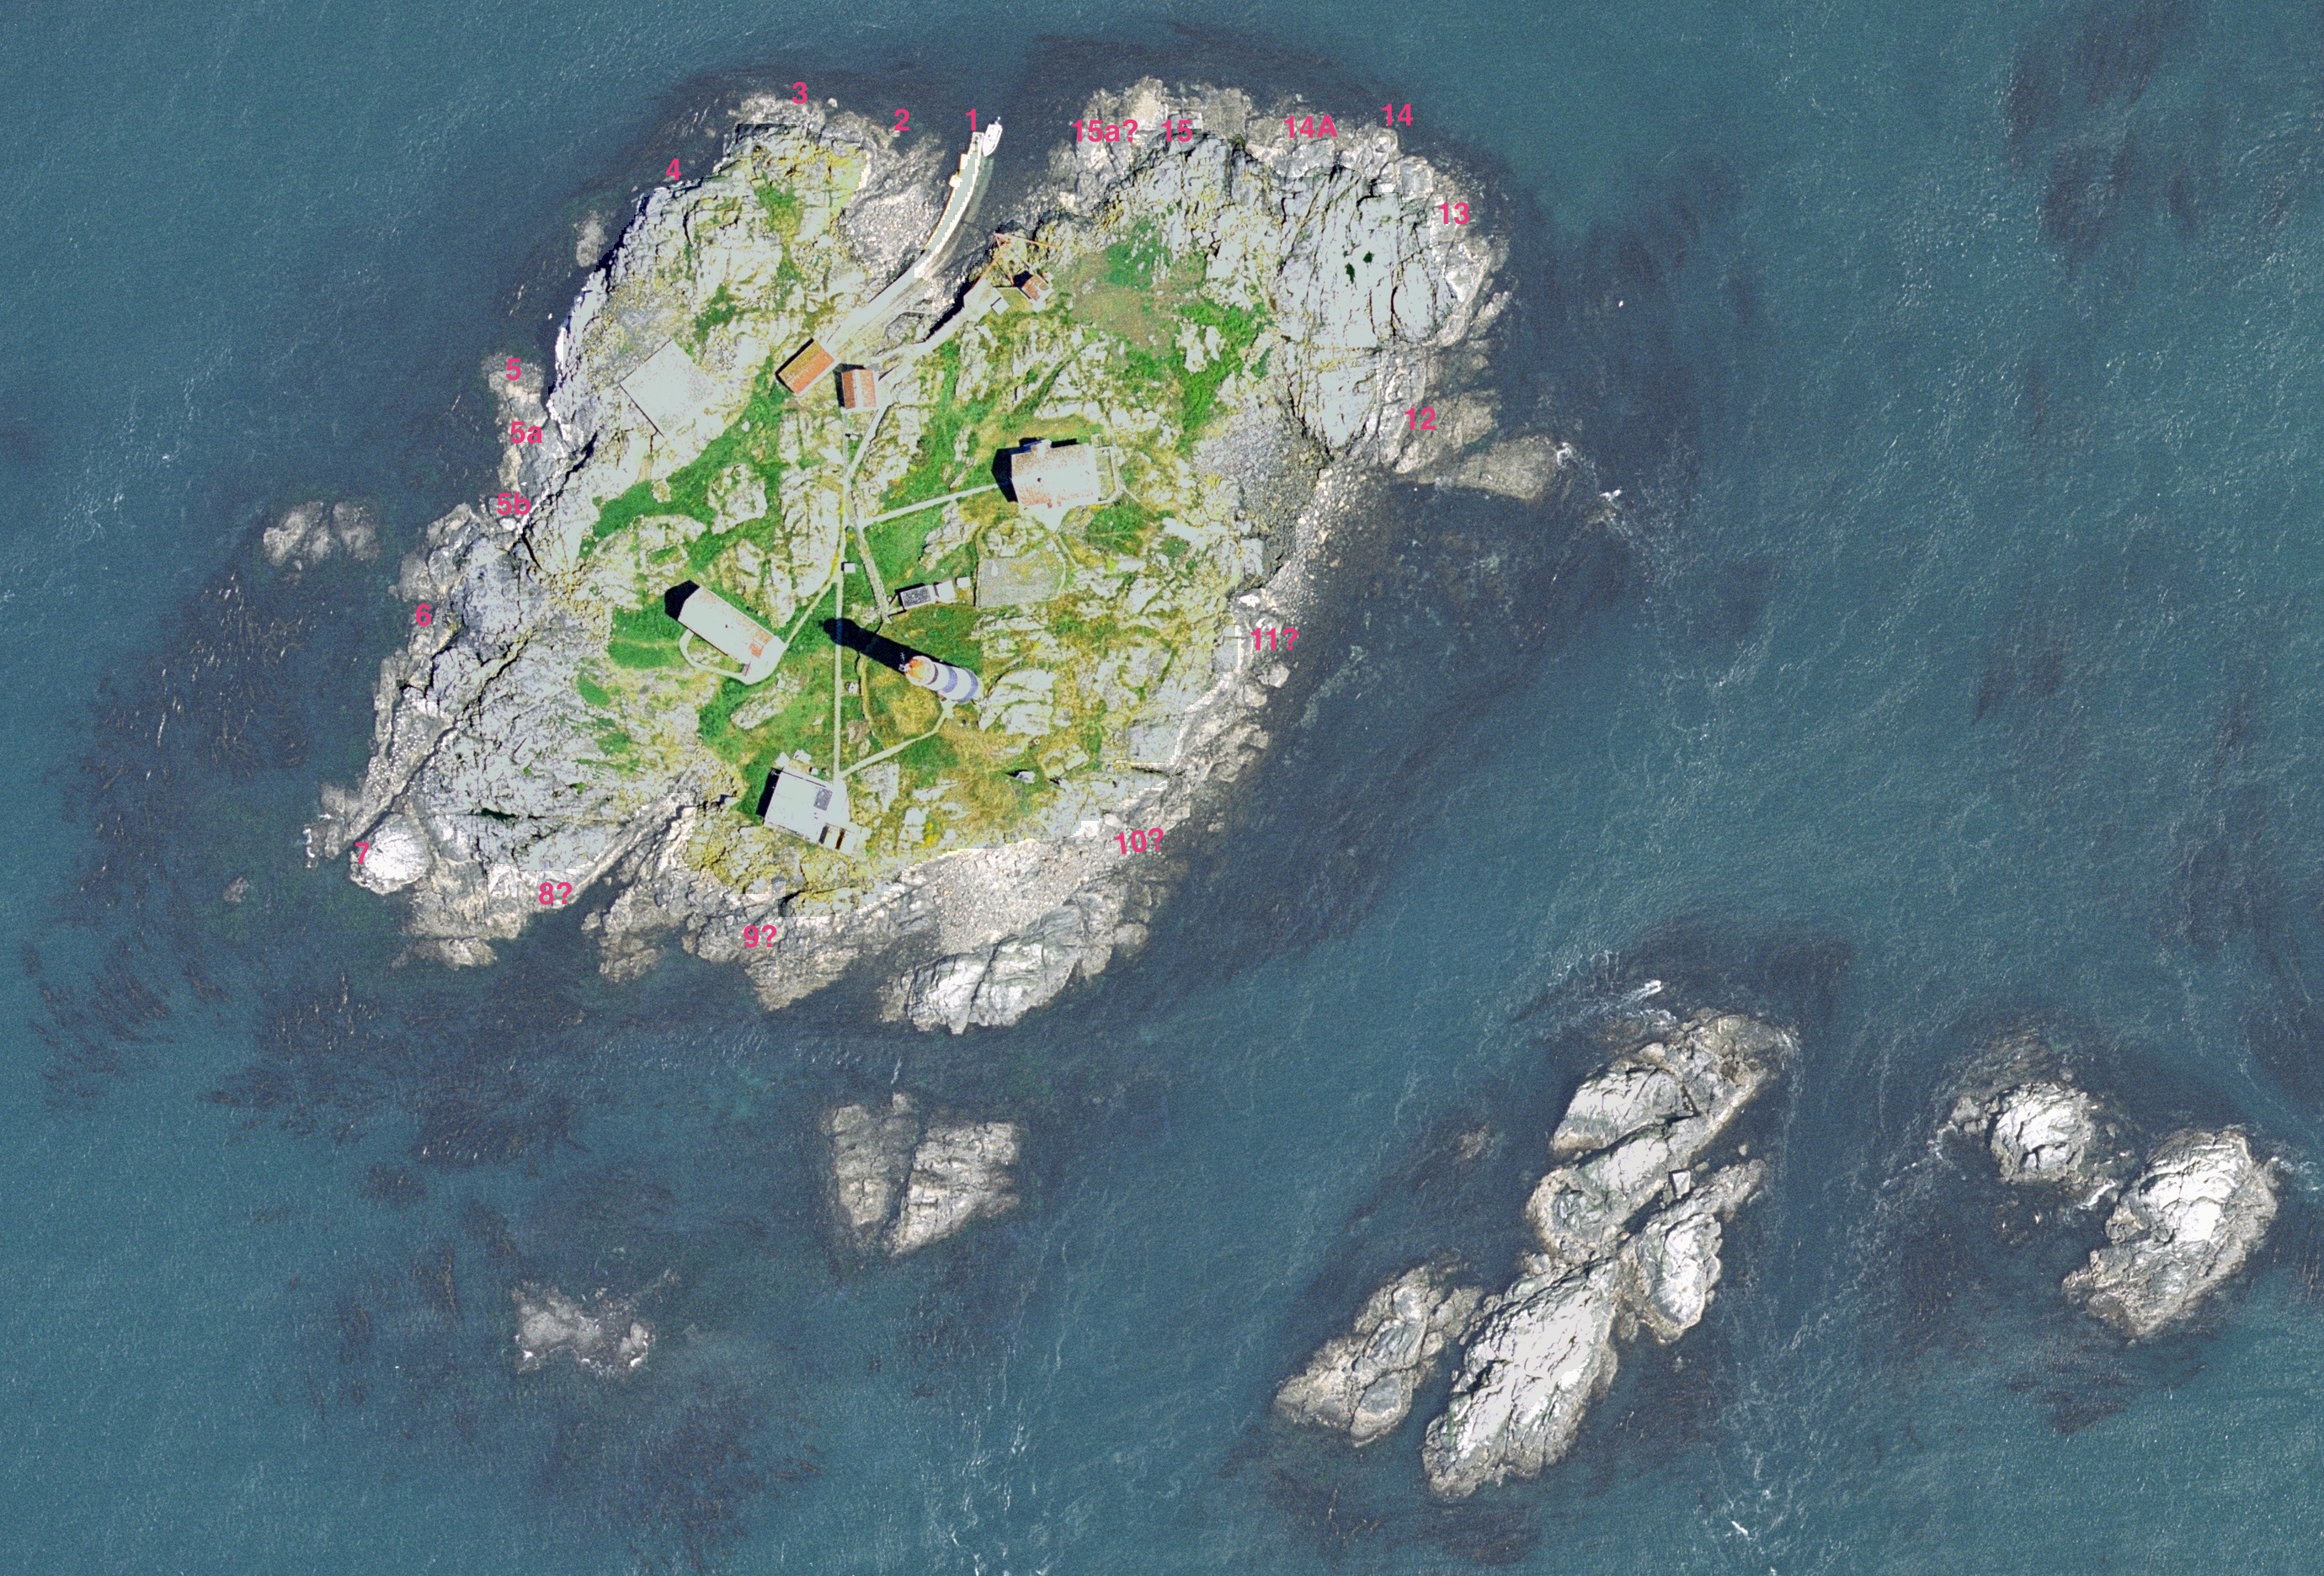
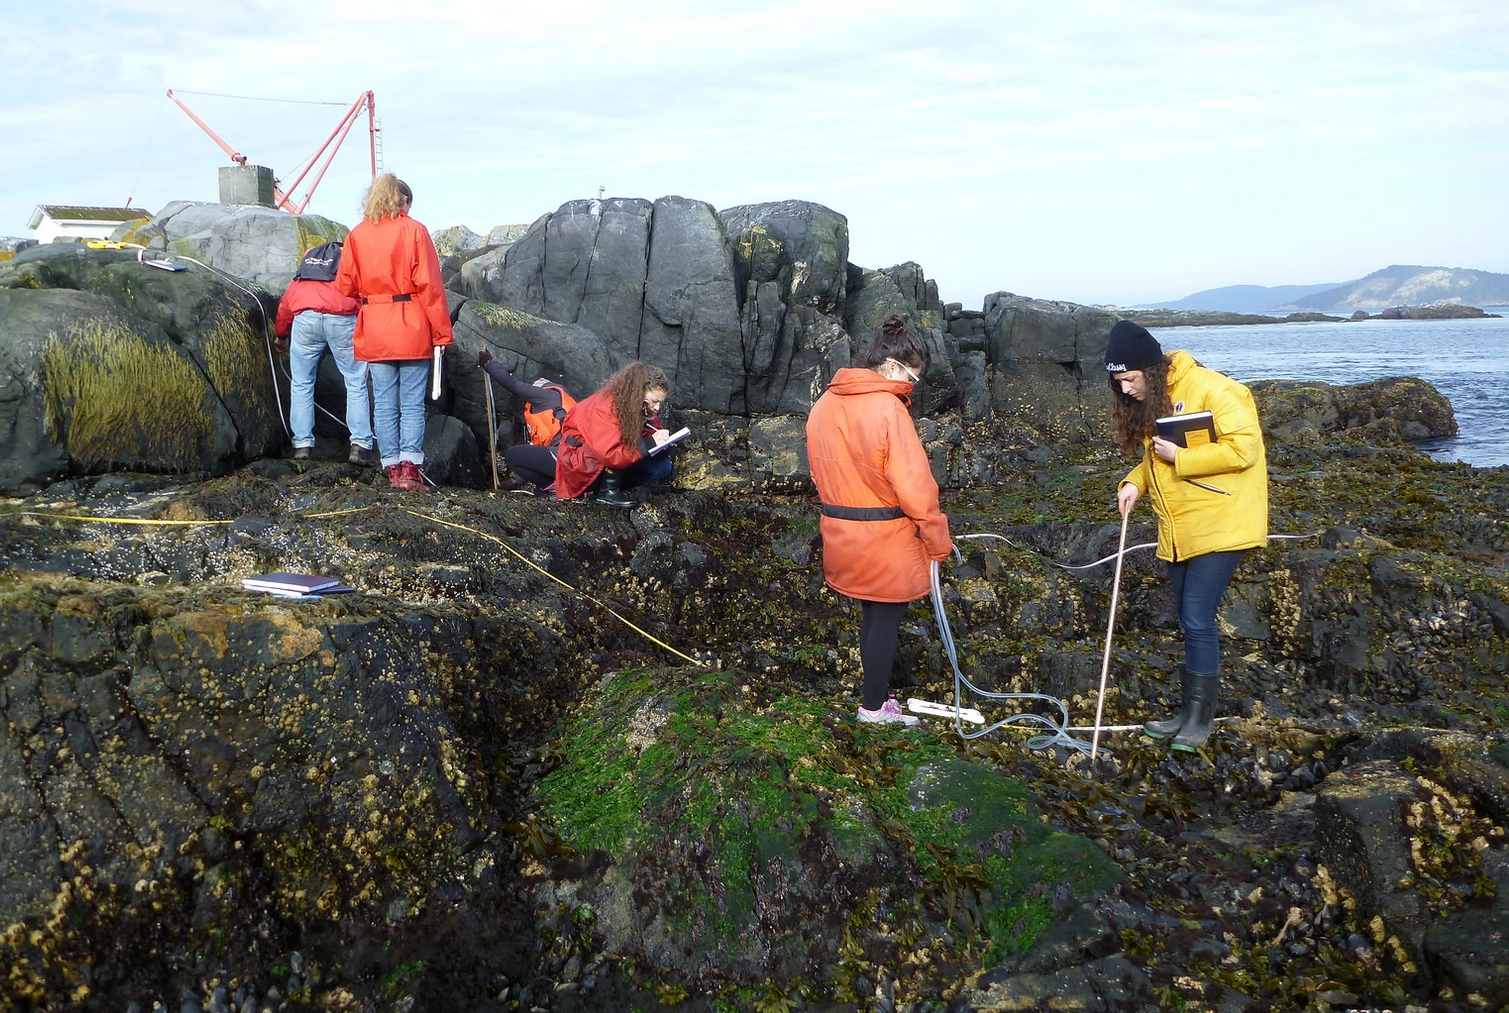
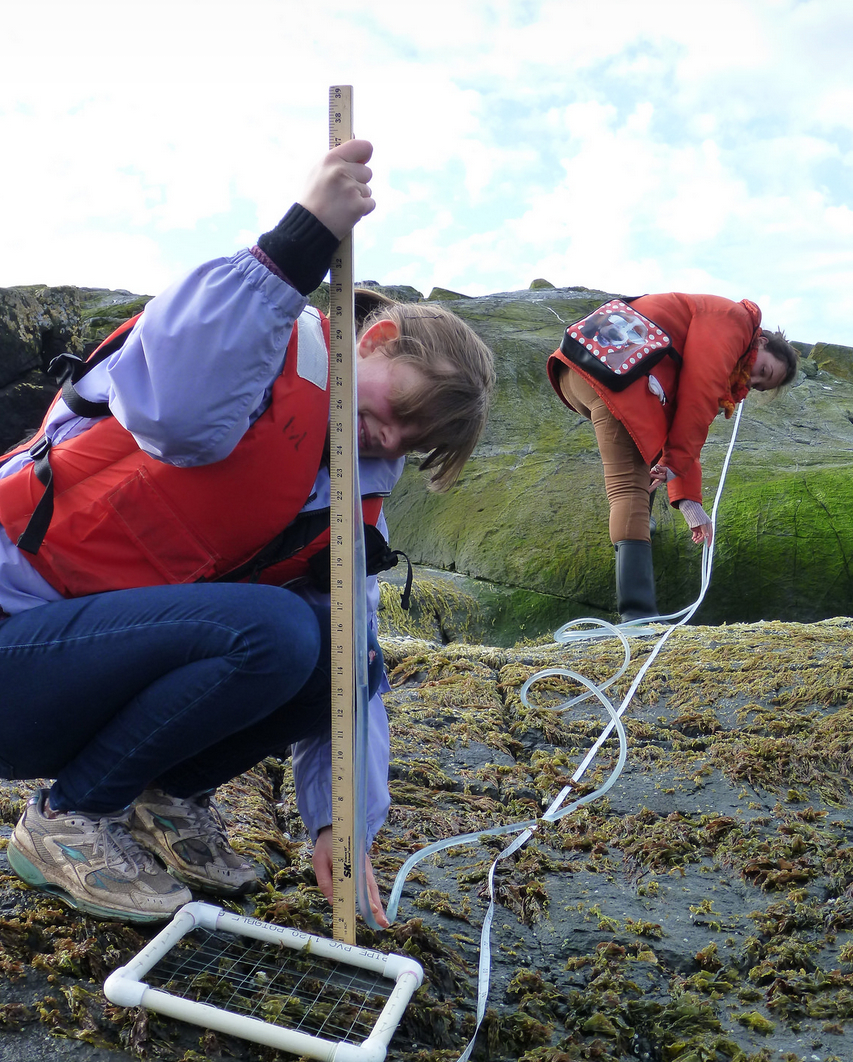
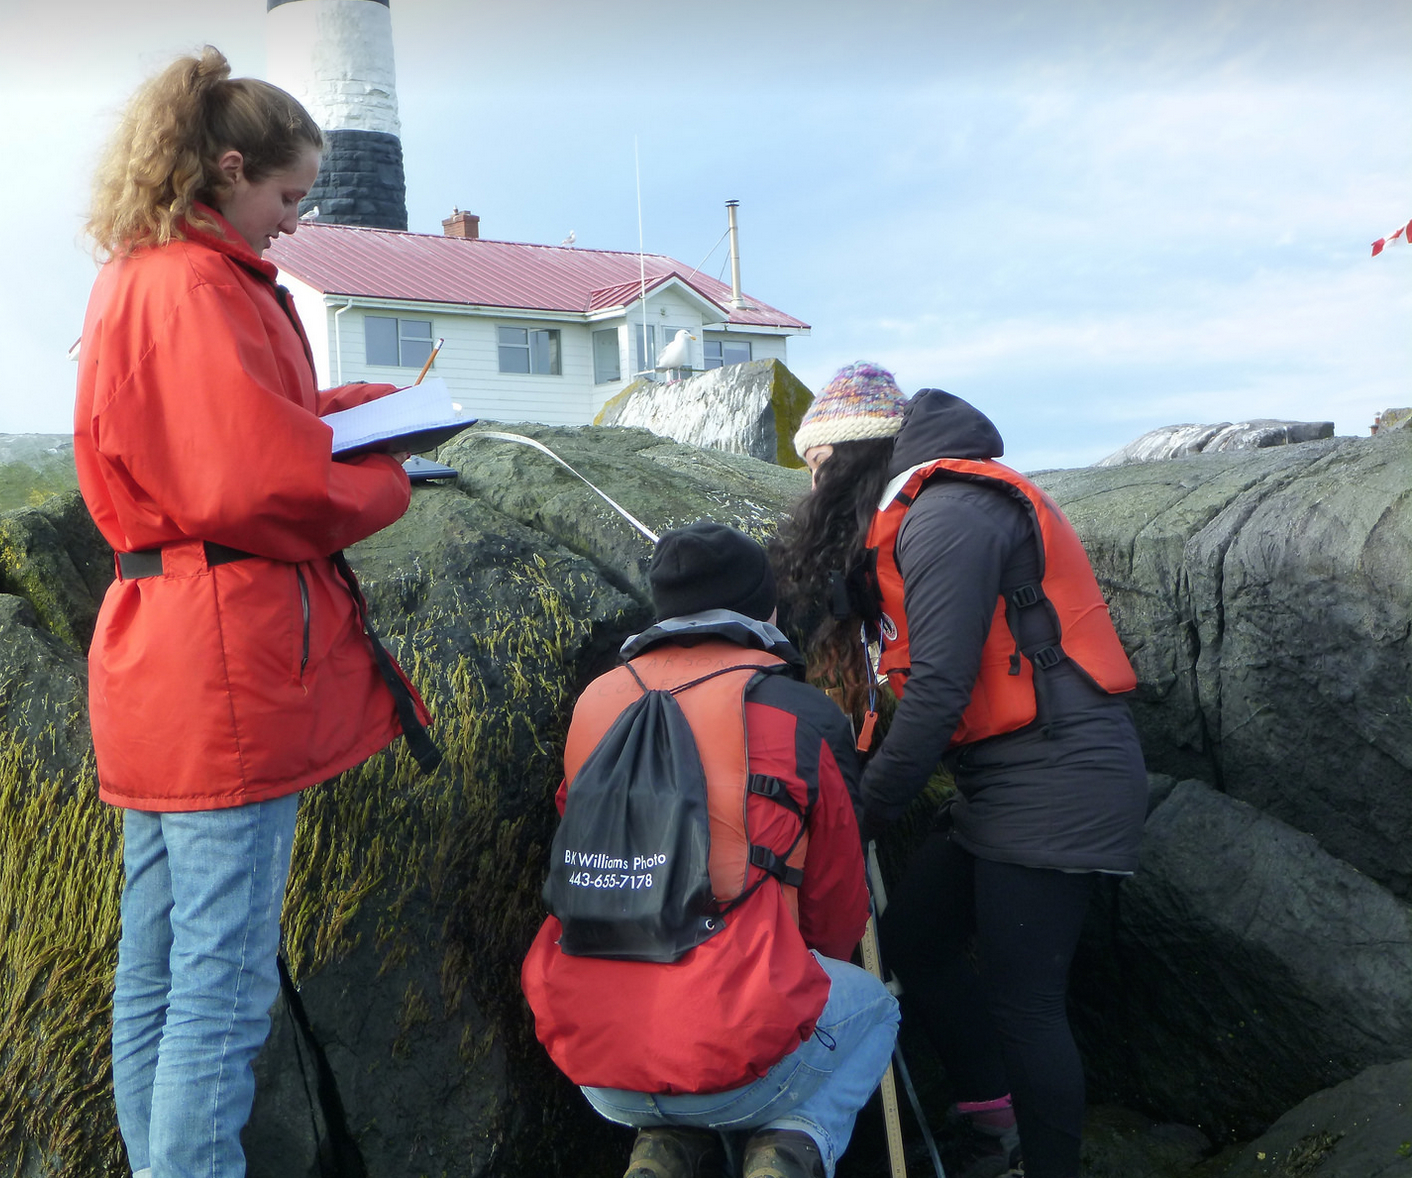
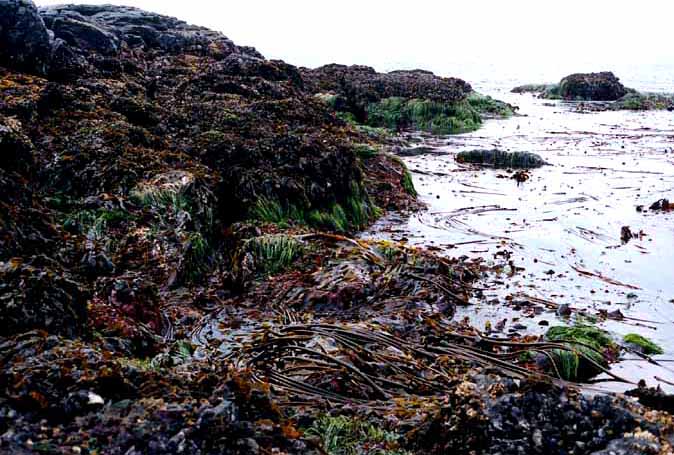
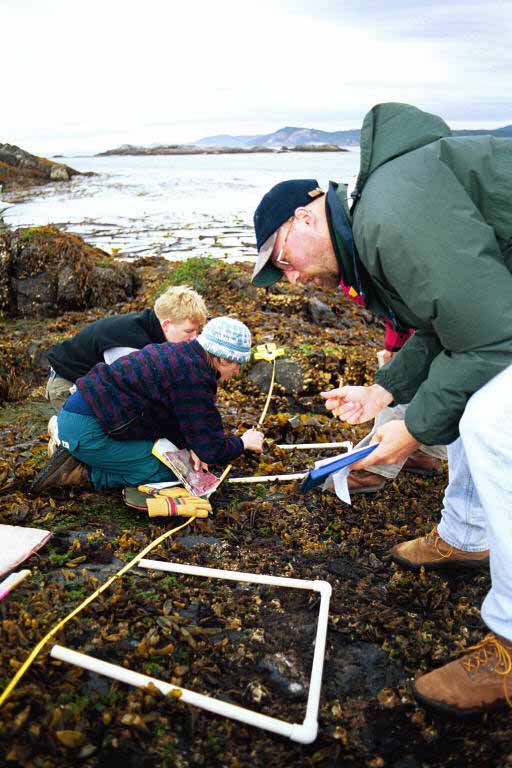
We have developed an exercise that allows one to take images from the transect file on the internet and process them, using the computer in order to quantify the ecological niche of organisms. The example provided is from the intertidal transect files from The Race Rocks ecological reserve, in Southern Vancouver Island, Canada.
Follow through the steps as indicated below.
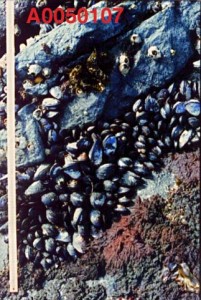
a0050107.

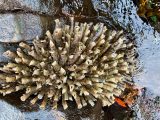
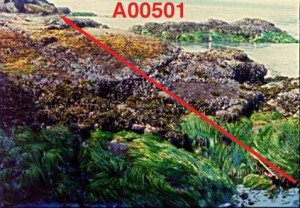
1. For instance from this image from the first transect, A00501, (A0 being the Race Rocks location, 05 being the sample station location and 01 being the first transect at that location, 07 being the seventh quadrat from the top of the intertidal zone. ). Quadrat 07 looks like this. By clicking on this icon you will see this one sample of the actual photo from the transect file.

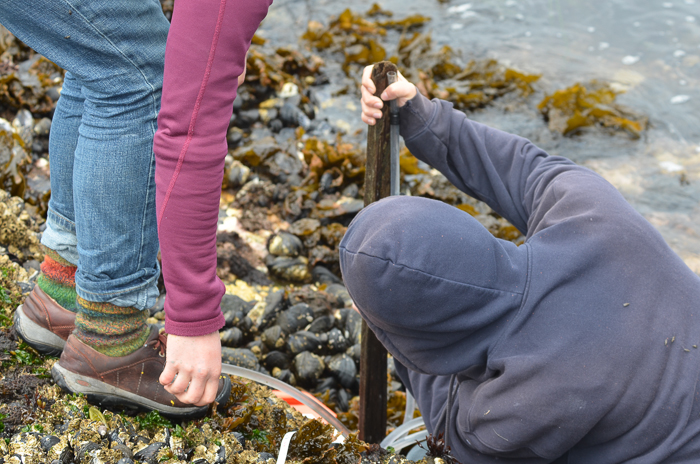
2. If we want to define the space that the mussels occupy in this quadrat, we have to measure the percent of the quadrat that they are covering. This could be done simply by cutting out a piece of acetate that has been made by xeroxing a piece of graph paper and overlaying it on the screen.

3. A more precise way of doing this is by using an Imaging program to help analyse different aspects of the photograph. Download this image by clicking on the full size image then pressing and holding the right mouse button on a PC or pressing and holding the mouse of a Macintosh . Note that the mussels occupy a portion of this quadrat, a meter stick on the left side gives you the size of the quadrat.

4. CONVERTING THE IMAGES:
Since the above image is in a .JPG format , it has to be converted to a .PICT format for image processing. Do this with a graphic processing program .

5. Using GifConverter: Open the .jpg file obove that you have downloaded. Save it as a .PICT file. This is the format that is necessary to use in the next stage of the process, using NIH Image to measure features of the picture.

6. If you do not have a copy of the freeware NIH IMAGE. Download it from this site. (Both Mac and PC versions are available)

7. INSTRUCTIONS FOR NIH IMAGE: See this file :

Measurement of Surface Area Using “NIH IMAGE”

Also there may now be other software that is easier to use for measuring surface area coverage if one does a google search.

UPDATE: Also from NIH .. ImageJ. http://wsr.imagej.net/distros/

Calibration:
a) To calibrate the image in terms of real units: Use the straight line tool on the left panel, and draw it the length of the meter stick.
b) Use the pull-down menu called “Analyze”; go to “Set scale” . Change the units to centimeters, and “known distance” to 100.00, then hit “OK”.
c) To compute area: From “Tools” menu, select the heart-shaped tool. Outline the total area occupied by mussels. Click on “Analyze options” ; be sure the area box is selected). Press “OK”. From tool bar, select “Analyze”, “Measure”, “Analyze”, “Show results”. A table appears with the area of mussel coverage (in cm2). To compute % area occupied by mussels, measure the total quadrat area with the above procedure except use the rectangle measurement tool to outline the entire quadrat box.

8. DOWNLOADING THE TRANSECT IMAGES: Now, repeat this procedure with all the quadrats in the belt transect strip that contain mussels, you will also have to copy down the elevation found at the base of each quadrat as well..

Go to one of the transect files.

See Transect A0050101
See Transect A0050102
See Transect A0050103

a00501


9. Select one of the transects, and download the clips.


tr50110. USING A SPREADSHEET
Now we have to enter the data into an EXCEL or other suitable spreadsheet.. We will give the detailed instructions for EXCEL.
Enter data in column format (each column is a separate variable).
Calculate:
(a) % area covered by mussels for each transect (area covered by mussels/total area)
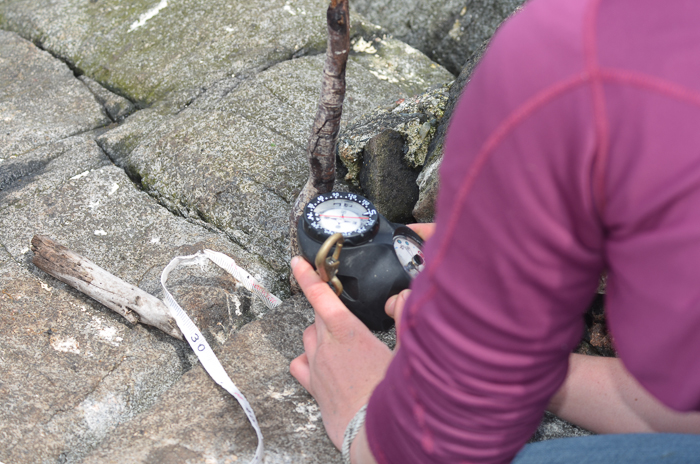
(b) percent slope: distance in perpendicular height (elevation change between adjacent quadrats divided by the linear distance (one meter) .
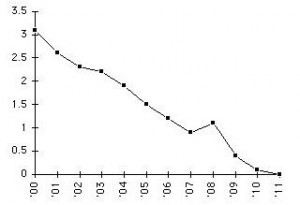
To evaluate terrain gradient for each transect (that is, the steepness of the intertidal shoreline), you can graph the relationship between elevation and slope .

excelfile 
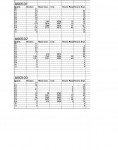
See this example .Here is a sample of the mussel distribution data as it appears on this spread sheet


musPLOTTING IN 3D

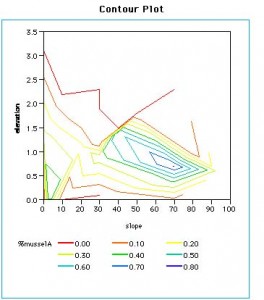
The goal of the analysis is to both describe and predict the environmental space that mussels must occupy in order to survive. The first step in the formal process is a graphical description of the environmental space actually occupied by the animals. In this example, the environmental space is the two dimensional space defined by the variables elevation and slope; the biotic “response” is the percent area occupied by mussels.We imported the variables X1 = “elevation”, X2 = “slope”, Y = “% mussel area” into a standard 3D graphics package (e.g. JMP-Contour Plot). The resulting graph gives the contour plots of mussel density as a function of the 2 environmental variables. Interpretation is similar to reading contour lines on an ordinary topographical map. Note that the “optimum” area for mussel settlement is a range of values for elevation and slope rather than a single point.

This file on Ecological Niche Models was developed by Penny Reynolds, Richard Rosecrance and Garry Fletcher at the Bioquest Consortium Workshop, on WHAT CAN WE LEARN FROM CONTEMPORARY MATHEMATICS REFORM? June 21-29, 1997. Beloit, Wisconsin. It was supported by a grant from the Howard Hughes Medical Institute to : The BioQuest Curriculum Consortium

1. Other websites on Photo transects :

Getting to the bottom of things

http://sango.churashima.okinawa/monitoring_en/cpc.html

Marine Algae of Hawaii.

Location of the photographic transects recorded during the benthic survey of the reefs in the Pondoland Marine Protected Area,

Return to the Contents page for Environmental modelling with Transects..

Dr. Anita Brinckmann-Voss and Hydroid Research at Race Rocks

anitaDr. Anita Brinckmann-Voss  passed away in December of 2017.

From 1986, to 2005,  Dr. Brinckmann-Voss of Sooke, BC assisted the students and faculty of Lester Pearson College with her understanding of marine invertebrate ecology and her expertise in the taxonomy of hydroids.  These small colonial animals, the alternate stage of the life-cycle of jellyfish, occur in rich profusion underwater at the Race Rocks Marine Ecological Reserve.  When the original species list was done for the Race Rocks Ecological Reserve Proposal, in 1979, only 2 hydroids had been included on our species list. Now over 60 species have been identified by Anita and she continued to assist students with research projects while she furthered her research on specimens from the island until 2004. Anita has established long term research plots in a tidepool at the reserve and documents the distribution of hydroids underwater with the assistance of students and faculty in the Diving program at Lester B. Pearson College. Below: Anita accompanied Garry, Chris and Joe on a dive to Secretary Island, West of Race Rocks up the Strait of Juan de Fuca towards Sooke. The purpose was to collect samples for hydroid specimens.  

anitaandsvobodaDr. Armin Svoboda and his son Hanno visited Race Rocks with Chris Blondeau and Dr. Anita Brinckmann-Voss in August of 2004. His pictures taken on a dive there are linked here.


 See this link for the hydroids identified by Anita. https://www.racerocks.ca/tag/hydroid/ 

See all the posts on this website tagged with Dr. Anita Brinckmann-Voss

bellatitle-1Gallery of photomicrographs of Hydroids- photos by Dr. Anita Brinckmann-Voss

tubulariaVideo on the habitat of a rare Tubularia


westshorePhotos of  Intertidal Hydroid Habitat on West side of Race Rocks .


PUBLICATIONS of Dr. Voss from her Research at Race Rocks Ecological Reserve :

 1. Brinckmann-Voss, A. , Lickey, D.M. , and Mills, C.E. 1993 Rhysia fletcheri (Cnidaria, Hydrozoa, Rhysiidae), a new species of Colonial Hydroid from Vancouver Island British Columbia, Canada) and the San Juan Archipelago (Washington, USA) . Canadian Journal of Zoology 71: 401-406

Abstract: 

  • A new species of colonial athecate hydroid, Rhysia fletcheri , is described from Vancouver Island, British Columbia, Canada, and from Friday Harbour, Washington, U.S.A. It’s relationship to Rhysia autumnalis Brinckmann from the Mediterranean and Rhysia halecii (Hickson and Gravely) from the Antarctic and Japan is discussed. Rhysia fletcheri differs from Rhysia autumnalis and Rhysia halecii in the gastrozooid having distinctive cnidocyst clusters on its hypostome and few, thick tentacles.
  • hydrfemeMost of its female gonozooids have no tentacles. Colonies of R. fletcheri are without dactylozooids. The majority of R. fletcheri colonies are found growing on large barnacles or among the hydrorhiza of large thecate hydrozoans. 
  • Rhysia fletcheri occurs in relatively sheltered waters of the San Juan Islands and on the exposed coast of Southern Vancouver Island. Colored photos of Rhysia males. females and gastrozooids are included.

 2. Brinckmann-Voss, A. 1996. Seasonality of Hydroids (Hydrozoa, Cnidaria) from an intertidal pool and adjacent subtidal habitats at Race Rocks, off Vancouver Island,Canada, Scientia Marina Advances in Hydrozoan Biology , Vol 60 (1):89-97

Abstract:

  • An assemblage of 27 hydroid species was reported from a tide pool in the lower rocky intertidal zone, and compared with 42 hydroids of the adjacent subtidal region. Location of hydroids within the pool, seasonal occurrence, growth and sexual maturity were tabulated, and some systematic aspects discussed. Possible causes of hydroid species diversity were considered, including location of the tide pool in an area of tidal rapids, and shading by surf-grass and rock cliffs during low tide.

Johan Ashuvud Project at Race Rocks -2004

During the Johan Ashuvud project 2004, students explored the intertidal with Garry Fletcher. They examined various organisms as well as the artificial tidepool. In this video, we also get a chance to meet all the students taking part in the project.