Long-term sampling programmes are often used to follow changes in the abundance of plants and animals over time. We will be looking at changes in the abundance of algae and invertebrates at Race Rocks. These changes will be examined with respect to changes in water temperature. The sampling method we will be using is called a stratified-random sample.
What is stratified random sampling?
In a stratified random sample we will sample the sea floor in a random manner, that is there will be no predetermined pattern to the sampling programme. The samples will be stratified because we will make sure that three depths are represented equally in our random samples.
What will we need?
Each dive pair will need
– a slate (with pencil)
– a pair of vernier calipers
– pre-mixed epoxy, and petersen discs
– a set of 20 random number
How will we sample?
We have established 6 permanent transects around Race Rocks. Each transect is 30 metres long and runs from the shallow subtidal to about 10m depth. Once a dive pair has located the transect they will be working on, a tape measure will be tied to the shallowest pin (the 0 metre pin) and laid out down to the last pin (30 metre pin).
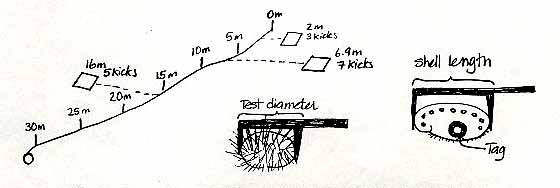
Before the dive, each dive pair will determine a set of 20 random numbers from a random number table (attached to these pages). There will be two numbers, both between 0 and 9. The first number will refer to the distance along the tape measure, let us say 6.9 metres (it will be the first two numbers, where-ever you start on the table, ie:69). The second number, let us say 7, will refer to the number of flipper kicks right or left of the line. The dive pair will swim along the tape locate the 6.9 mark, then left 7 kicks to the right or left of the 6.9 metre mark. After 7 kicks the diver drops the quadrat and starts to count all the invertebrates and seaweed in the quadrat.
While one diver does the counting and recording, the second diver will measure all of the sea urchins in the quadrat, recording the test diameter of each sea urchin to the nearest cm. Likewise the length of any abalone in the quadrat should also be measured, the abalone should also be tagged, using epoxy and a Petersen disc tag. The tag number should be recorded along with the length of the ablaone. Any abalone you see outside of the quadrat can also be measured and tagged.
Once the quadrat count and the measuring is completed, the dive pair returns to the tape measure, and repeats the process, using the next set of random numbers. In total divers will sample 20 quadrats between 0-10m (10 quadrats on the right side of the line, 10 quadrats on the left side), 20 quadrats between 10-20m and 20 quadrats between the 20-30m, for a total of 60 quadrats per transect. The transects will be sampled twice a year.
 Once the dive pair has sampled 20 quadrats from between the 0-10 pins, they move down to the 10-20 metre pins and repeat the process, as time and air supply allow. If it is easier, three dive pairs can work on each transect line, one dive pair working in the 0-10m area, the next pair in the 10-20m area and the third pair in the 20-30m area. Dividing the transect into three areas is the stratified part of the sampling design, using the random number table is the random part of the sampling design.
Back at the College
Wash all the sampling gear you used with fresh water, and return to its appropriate place. Back in the lab you will need to wash the salt off your data sheet, and copy the sea urchin measurements and abalone tag/measurements onto the back of the data sheet for the section of the transect line you and your partner sampled. You will also need to make sure that all of your numbers are readable, and that you have filled in all of the blanks on the data sheet.
During later lab periods you will be entering this data, and calculating the average (mean) density of the animals and seaweed you counted along each transect line. Subsequent years of Pearson College students will continue this sampling programme to generate a long-term view of how invertebrate and algae abundance changes over time.
Temperature records.
 The Hobo thermograph that you will be installing, will automatically record water temperature. The temperatures are stored in the thermograph, and are down-loaded onto a programme that will be installed on the computers in the biology lab. The programme is very easy to use.
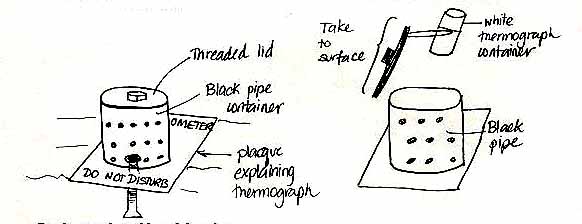
The thermograph will be installed in a black plastic pipe, bolted to the sea floor. The thermograph will be in a white water-tight container inside the pipe. To retrieve the thermograph divers will swim to the black pipe and using a filter wrench and a pipe wrench they will unscrew the lid on the black plastic pipe. Attached to the lid of the black plastic pipe, will be the white thermograph container. The divers bring the lid and the white thermograph container to the surface. DO NOT UNSCREW THE WHITE THERMOGRAPH CONTAINER UNDERWATER, THE COMPUTER INSIDE IT IS NOT WATER PROOF. THE THERMOGRAPH CAN ONLY BE REMOVED IN THE DRYNESS OF THE LAB.
Once the data have been down-loaded, the thermograph can be placed back in the white container, (the o-ring should be re-greased), the white container should be reattached the black lid, and on then the black re-screwed into the black pipe on the next dive. You will need to reset the thermograph right before you go diving.
Diagram of Hobo temperature apparatus appears here
Insert Random number table and data sheet.
Following is a page of random numbers, you should make sure that you are comfortable using this table. Likewise there is a data sheet, please make sure that you are familiar with the species listed on the data sheet, and that you will be able to identify them underwater.
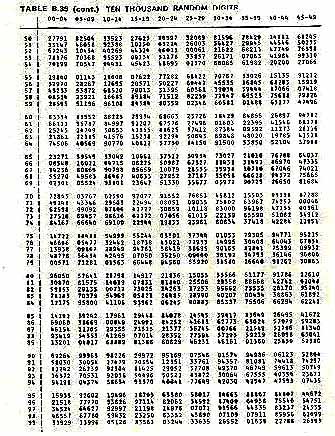 Random number table — 10,000 random numbers
27791 82504 33523
33147 46058 92388
67243 10545 40269
78176 70368 95523
70199 70547 94331
The first ten numbers in the last line are interpreted as: 7.0 m 1 kick, 9.9 m 7 kicks, 0.5 m 4 kicks, 7.9 m 4 kicks
TABLE B.39 (cont.) TEN THOUSAND RANDOM DIGITS
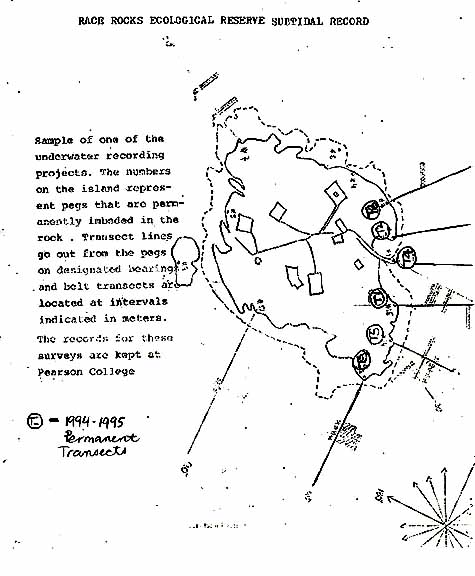 Sample of one of the underwater recording projects. The numbers on the island represent pegs that are permanently imbedded in the rock. Transect lines go out from the pegs on designated bearings and belt transects are located at intervals indicated in meters. The records for these surveys are kept at Pearson College.
T = 1994-1995 permanent transects
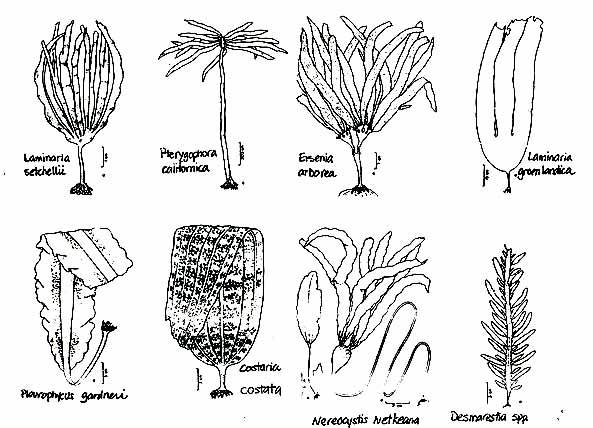 There will be other species of algae that we add to our list.
Sampling
To sample the invertebrates at each of the permanently marked sites we will be using quadrats. Most of you will have done quadrat sampling before.
We will be using a random – sampling method, in which quadrats are placed randomly along / or near the transect line, and the selected invertebrates and algae in each quadrat will be counted. From these data we will calculate the mean (average) abundance as well as the variation in abundance that occurs at each site. These data will plotted in graphs which compare the abundance of each species over time, and with respect to changes in temperature.
We will go over the sampling methods prior to starting the project. Data will be recorded on data sheets pre-printed on underwater paper. An example of the type of data sheet we will be using is attached.