
Link to Race Rocks Mean Monthly Sea Temperature 1921-present,
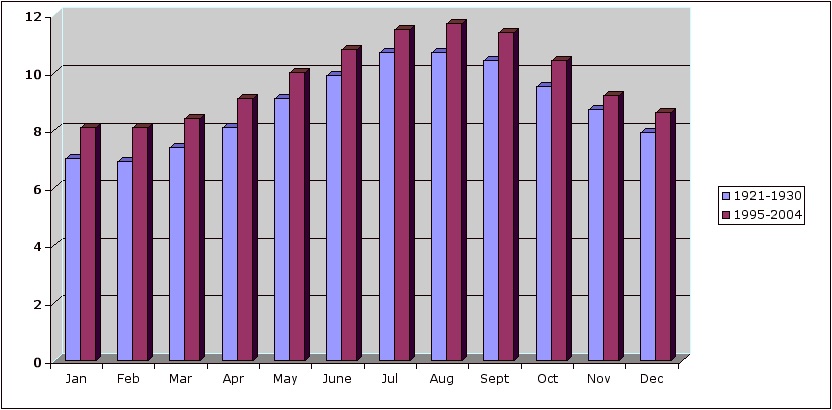
| Monthly temperature averages in degrees Celsius for Race Rocks | ||||||||||||
| 1921 | 1922 | 1923 | 1924 | 1925 | 1926 | 1927 | 1928 | 1929 | 1930 | Average | Month | |
| Jan | 6.4 | 7.1 | 7.1 | 6.6 | 7.8 | 7.6 | 6.9 | 7.1 | 6.5 | 7.0 | Jan | |
| Feb | 7.1 | 6.1 | 6.4 | 7.3 | 6.9 | 8 | 7.4 | 7.3 | 6.3 | 6.6 | 6.9 | Feb |
| Mar | 7.3 | 6.6 | 6.7 | 7.7 | 7.3 | 8.6 | 7.8 | 7.8 | 7.1 | 7.1 | 7.4 | Mar |
| Apr | 7.7 | 7.5 | 7.6 | 7.9 | 8 | 9.2 | 8 | 8.6 | 7.8 | 8.2 | 8.1 | Apr |
| May | 8.5 | 8.3 | 8.6 | 9 | 9.2 | 10.1 | 8.8 | 9.7 | 9 | 9.3 | 9.1 | May |
| June | 9.5 | 9.5 | 9.3 | 9.8 | 10.1 | 10.7 | 9.8 | 10.2 | 9.8 | 10 | 9.9 | June |
| Jul | 10.3 | 10.5 | 10.3 | 10.5 | 11.1 | 11.1 | 10.5 | 10.8 | 10.8 | 10.6 | 10.7 | Jul |
| Aug | 10.5 | 10.3 | 10.5 | 10.3 | 10.8 | 10.9 | 10.9 | 10.9 | 10.8 | 10.8 | 10.7 | Aug |
| Sept | 10.3 | 10.2 | 10.6 | 10.2 | 10.2 | 10.5 | 10.3 | 10.3 | 10.7 | 10.6 | 10.4 | Sept |
| Oct | 9.8 | 9.3 | 9.6 | 9.2 | 9.2 | 9.8 | 9.7 | 9.2 | 9.8 | 9.4 | 9.5 | Oct |
| Nov | 9.1 | 8.4 | 8.7 | 8.8 | 8.3 | 9.1 | 8.6 | 8.6 | 8.8 | 8.6 | 8.7 | Nov |
| Dec | 8.2 | 7.1 | 7.9 | 7.3 | 8.2 | 8.5 | 7.6 | 7.9 | 7.8 | 8 | 7.9 | Dec |
| 8.8 | Decade average |
|||||||||||
| Average | ||||||||||||
| 1995 | 1996 | 1997 | 1998 | 1999 | 2000 | 2001 | 2002 | 2003 | 2004 | |||
| Jan | 8.2 | 8.2 | 7.7 | 8.7 | 8 | 7.5 | 7.9 | 8.1 | 8.8 | 7.8 | 8.1 | Jan |
| Feb | 8.6 | 7.8 | 7.9 | 9.2 | 7.8 | 7.7 | 7.7 | 7.9 | 8.5 | 7.9 | 8.1 | Feb |
| Mar | 8.8 | 8.4 | 8.1 | 9.7 | 8.1 | 8.1 | 8.1 | 7.7 | 8.7 | 8.3 | 8.4 | Feb |
| Apr | 9.2 | 9.2 | 9 | 9.9 | 8.9 | 9.1 | 8.7 | 8.7 | 9.2 | 9.1 | 9.1 | Apr |
| May | 10.2 | 10 | 10.3 | 10.4 | 9.5 | 10 | 9.7 | 9.4 | 9.9 | 10.4 | 10.0 | May |
| June | 11.2 | 10.4 | 10.9 | 11.4 | 10.4 | 11.1 | 10.6 | 10.5 | 10.9 | 11 | 10.8 | June |
| Jul | 11.8 | 11.5 | 11.7 | 11.7 | 11.1 | 11.3 | 11.3 | 11.2 | 11.3 | 11.8 | 11.5 | Jul |
| Aug | 11.5 | 11.5 | 12.2 | 12.3 | 11.5 | 11.7 | 11.4 | 11.7 | 11.4 | 11.9 | 11.7 | Aug |
| Sept | 11.3 | 10.5 | 11.6 | 12.1 | 11.9 | 11.4 | 11.4 | 11.3 | 11.4 | 11.2 | 11.4 | Sept |
| Oct | 10.2 | 9.9 | 11.3 | 10.7 | 10.1 | 10.3 | 10.2 | 10 | 10.9 | 10.6 | 10.4 | Oct |
| Nov | 9.4 | 8.7 | 9.9 | 9.8 | 9 | 9 | 9.2 | 9 | 9 | 9.4 | 9.2 | Nov |
| Dec | 8.9 | 7.6 | 9.3 | 9 | 8.5 | 8 | 8.3 | 8.8 | 8.5 | 8.6 | 8.6 | Dec |
| 9.8 | Decade Average |
|||||||||||
| This analysis has been done by Garry Fletcher using the monthly averages of the daily temperatures. See this file for the complete set of monthly data1921 to present |
 |
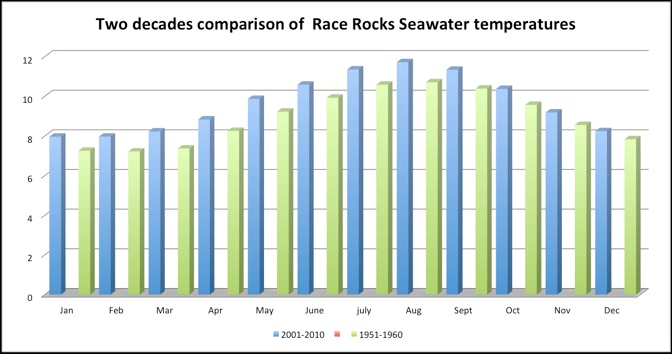
| The following is a comparison between 1951-1960 and 2001-2010
Jan Feb Mar Apr May Jun Jul Aug Sept Oct Nov Dec 2001 7.9 7.7 8.1 8.7 9.7 10.6 11.3 11.4 11.4 10.2 9.2 8.3 Monthly Means
|
See also https://www.env.gov.bc.ca/soe/indicators/climate-change/sea-surface-temperature.html