
In October, 2009, Lester Pearson College had an opportunity to participate in an offshore wind assessment test by AXYS Technologies Inc. in the Strait of Juan de Fuca .
See video of test in Juan de Fuca off Race Rocks
Sidney firm deploys world’s first wind buoy :
Times Colonist,October 28, 2009
The Wind Sentinnel deployed at Race Rocks on October 18, 2009 -Estimated duration is Oct. 16 – Nov. 16 (logistics/weather dependant) -Buoy Deployment Location – Lat: 48° 17.606’N Long: 123° 32.370’W -Communications – Buoy: Cellular phone -Communications – land station: Race Rocks LAN wired Ethernet connection
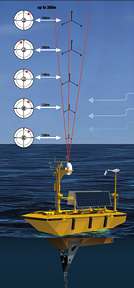
Great Race Rocks was used to host the land station for an offshore buoy which is designed to record wind speed and direction data profiles up to 200 meters height. It is anchored outside of the Race Rocks Ecological Reserve in the Strait of Juan de Fuca. Data from the buoy is relayed automatically every 10 minutes by cell phone to the instrument trailer on land and is transmitted to the internet through our LAN on Race Rocks
-

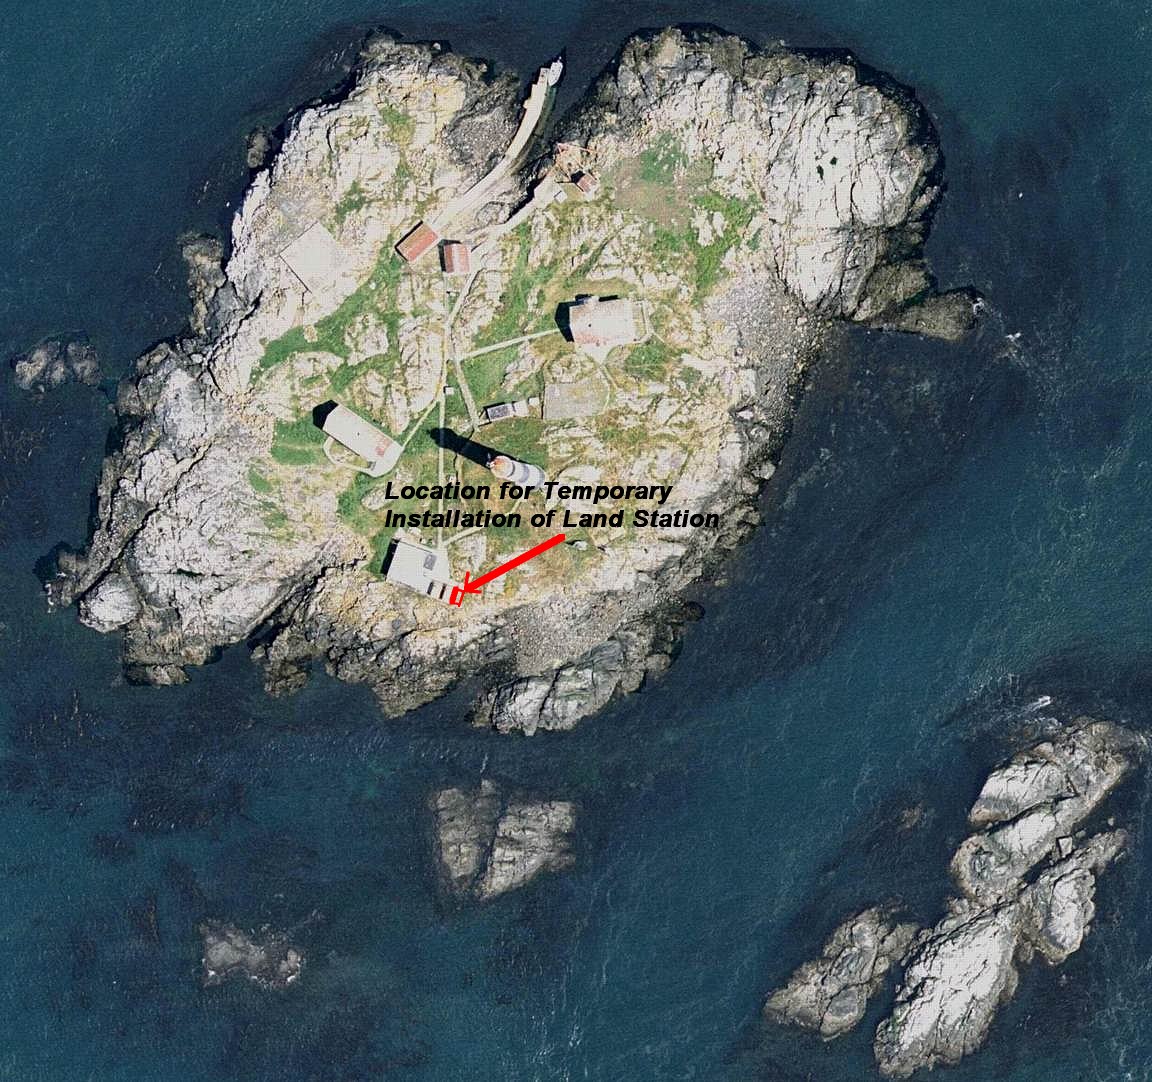
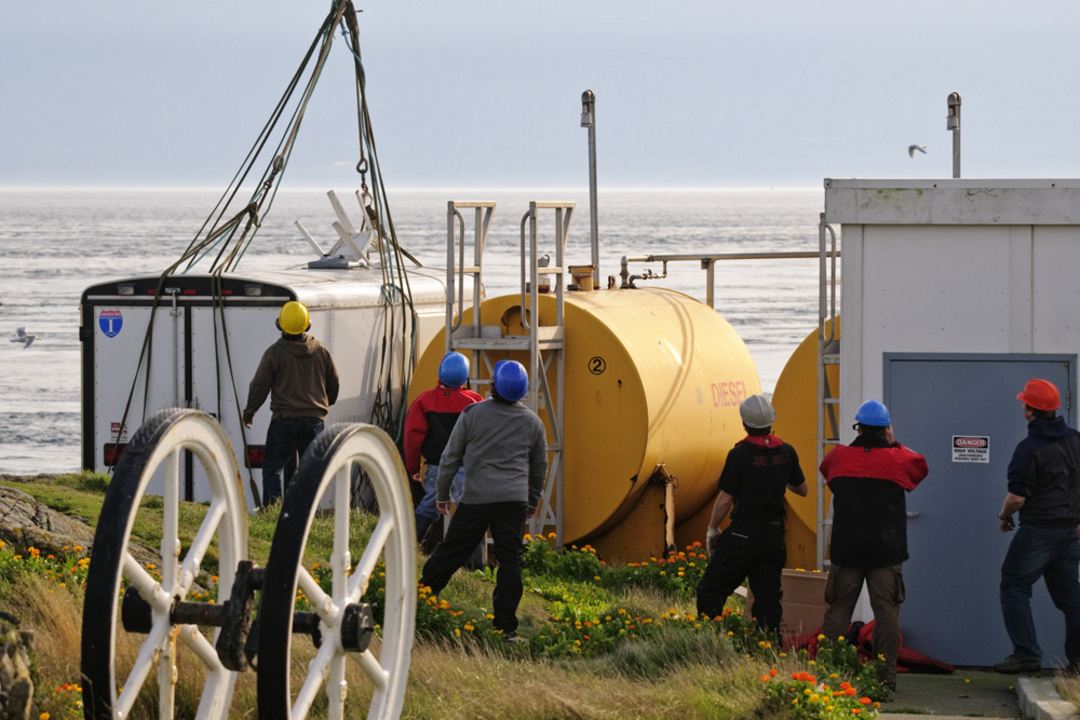
- Location for the installation of the instrumentation trailer land station.
-
- The land station is housed in a trailer

-
- Lowered on the pad beside the fuel tanks.

-

- These Pre-deployment images were provided by AXYS Technologies Ltd.
-
- The buoy can be viewed from camera 5.
-

- This trailer containing the instrumentation for the land station was installed on Great Race Rocks on the existing concrete pad near the oil tanks. Images by Ryan Murphy
-
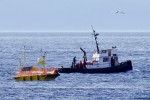
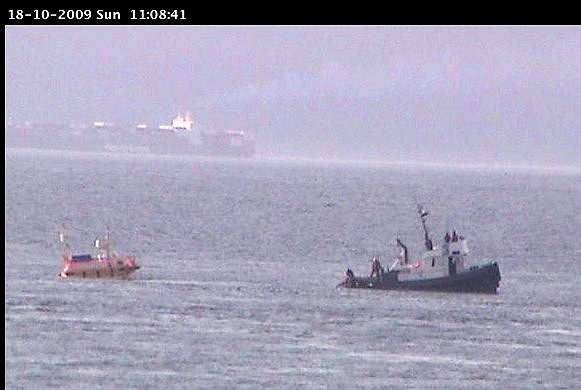
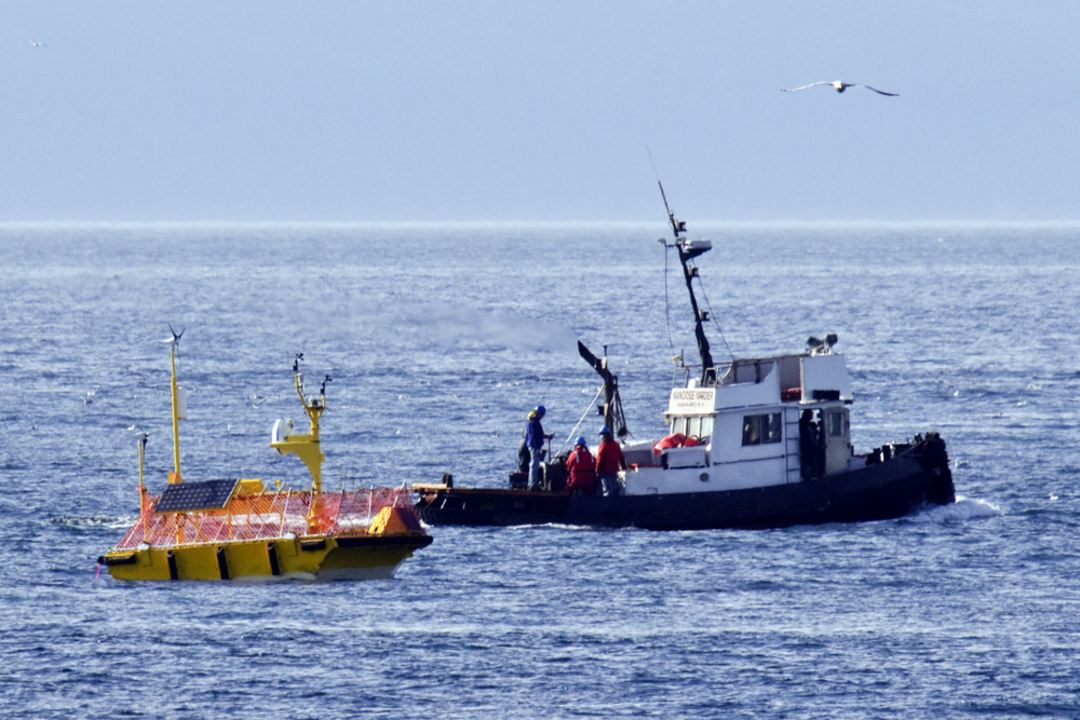
- A tugboat is used to position the weather buoy south west of the Ecological Reserve
-
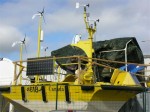
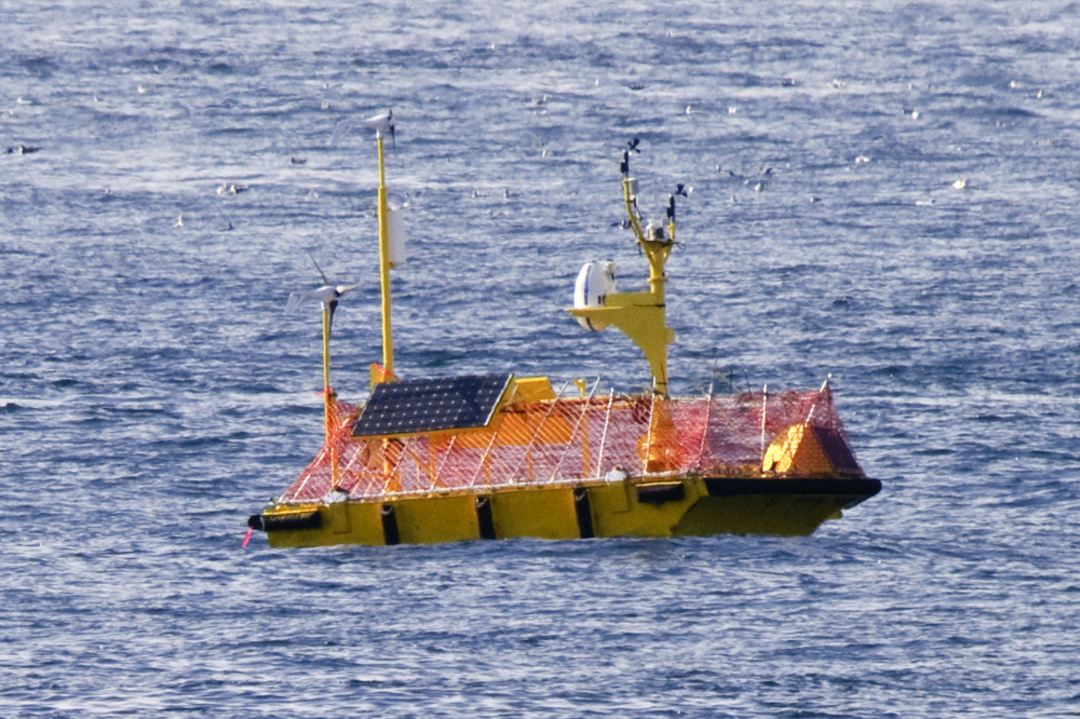
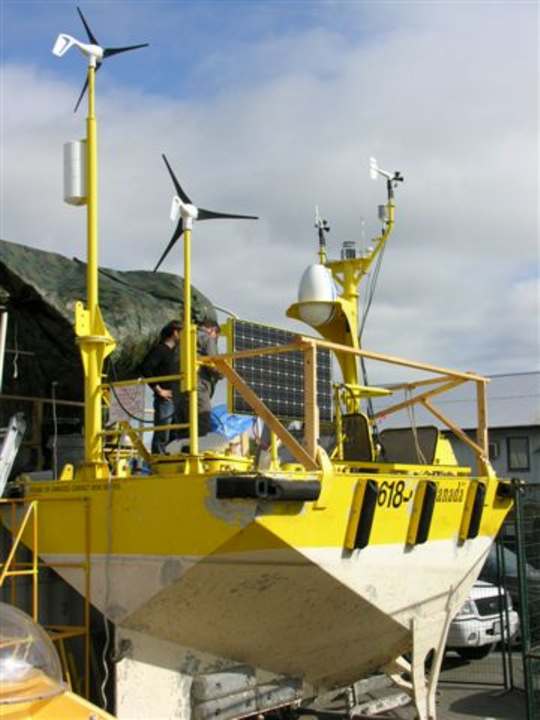
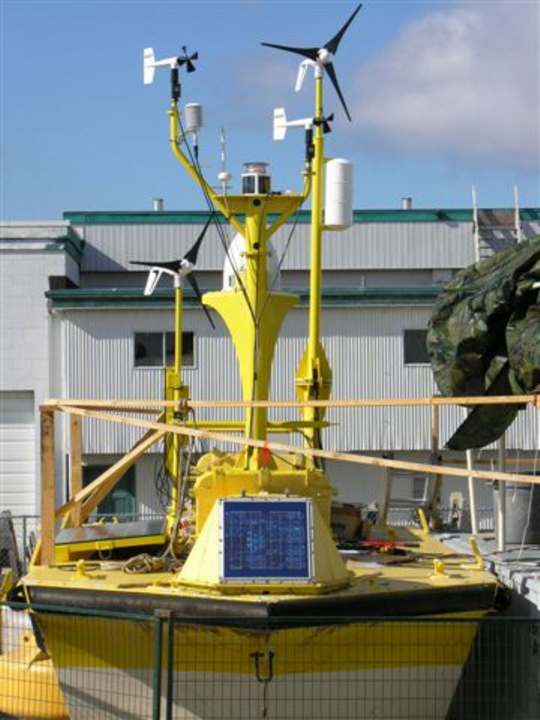
- This is the offshore buoy which was deployed in the Strait of Juan de Fuca at Lat: 48° 17.606’N Long: 123° 32.370’W

 Link to this brochure pdf with more specifications. AXYSWindSentinel
We will be able to benefit by adding the information collected to the knowledge base for the reserve. It will also be useful for planning for future sustainable energy applications.Our current wind measurements done by the Davis weather instrument we have installed on the ground level, often show at least a 10 km/h difference in wind velocity when compared with the Environment Canada data from the top of the tower at 36 metres. A set of data with projections to 200 metres will provide an excellent profile for comparisons.
See this sample file on Analyzing the data as an exercise.
Username: windtrial
Password: axyswind
The left hand window shows the station, which if you click on will expand out to show the messages (metocean and Waves) and if you click the + beside these you will get the individual data parameters which you can plot into a graph by selecting the checkbox of the parameter you want to graph and then clicking the Graph icon at the top of that window.
You can also see a table of the data by simply clicking on the message (click on the 1 MetOcean name and a table will appear on the RHS window with all the data)