A relatively calm Saturday on the Rock provided ample opportunity to finish off various tasks I didn’t quite have the time to complete over the last week – including the monthly calibration of our salinity measurements. What’s that, you ask?
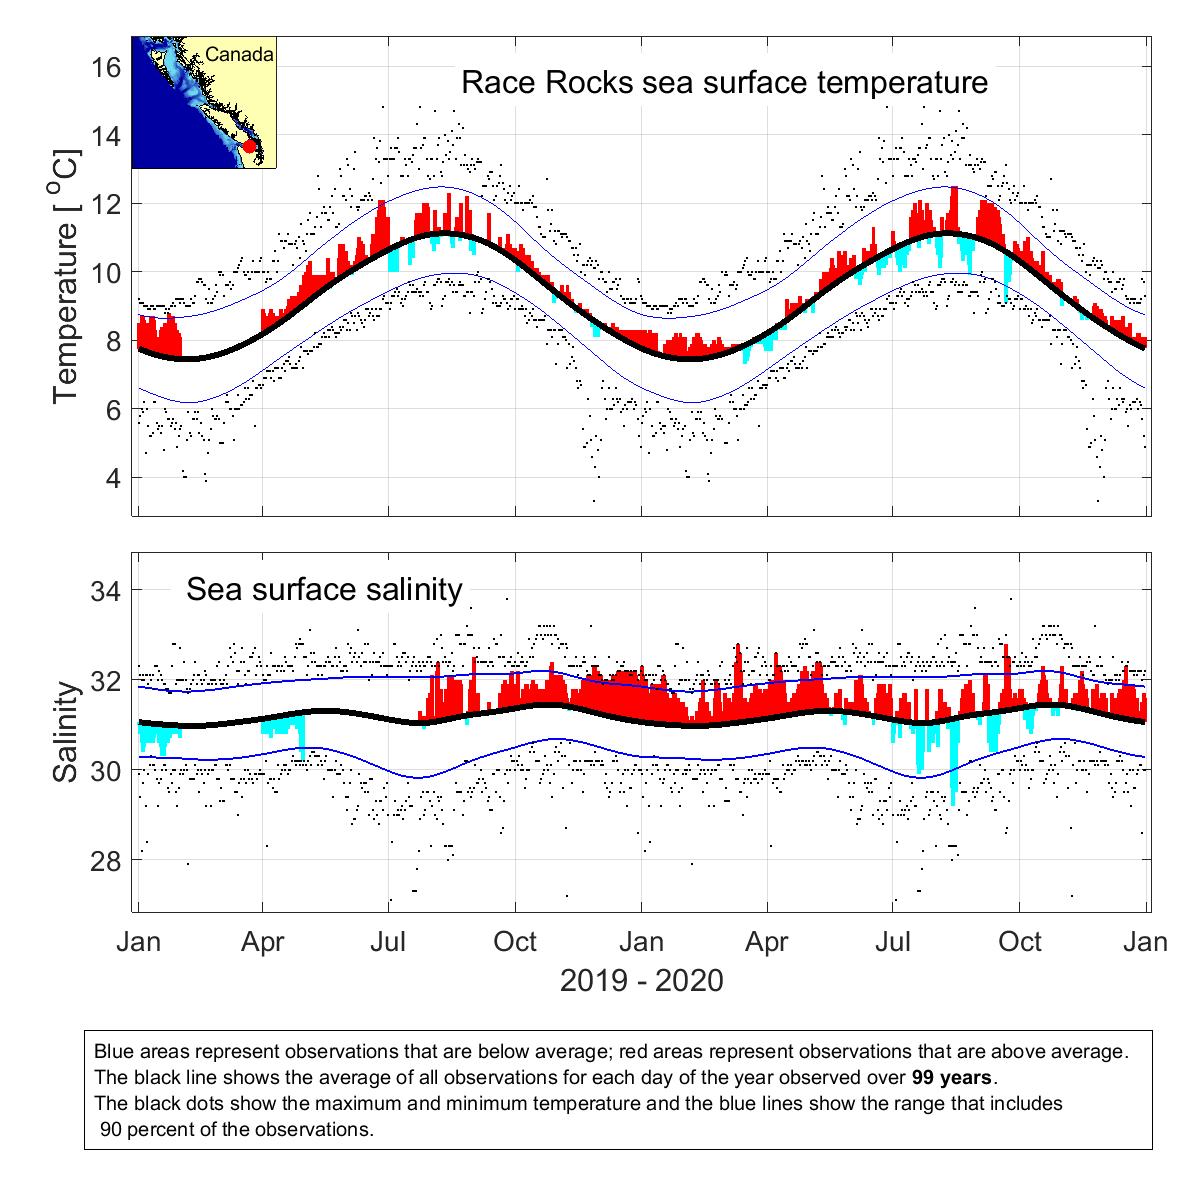
For decades, Race Rocks has been an important site for collecting seawater data – thus creating a valuable longitudinal data set. Every day at maximum flood,* a measurement is taken from the end of the jetty (lifejackets mandatory, especially in rough conditions!), recording both current salinity and temperature.
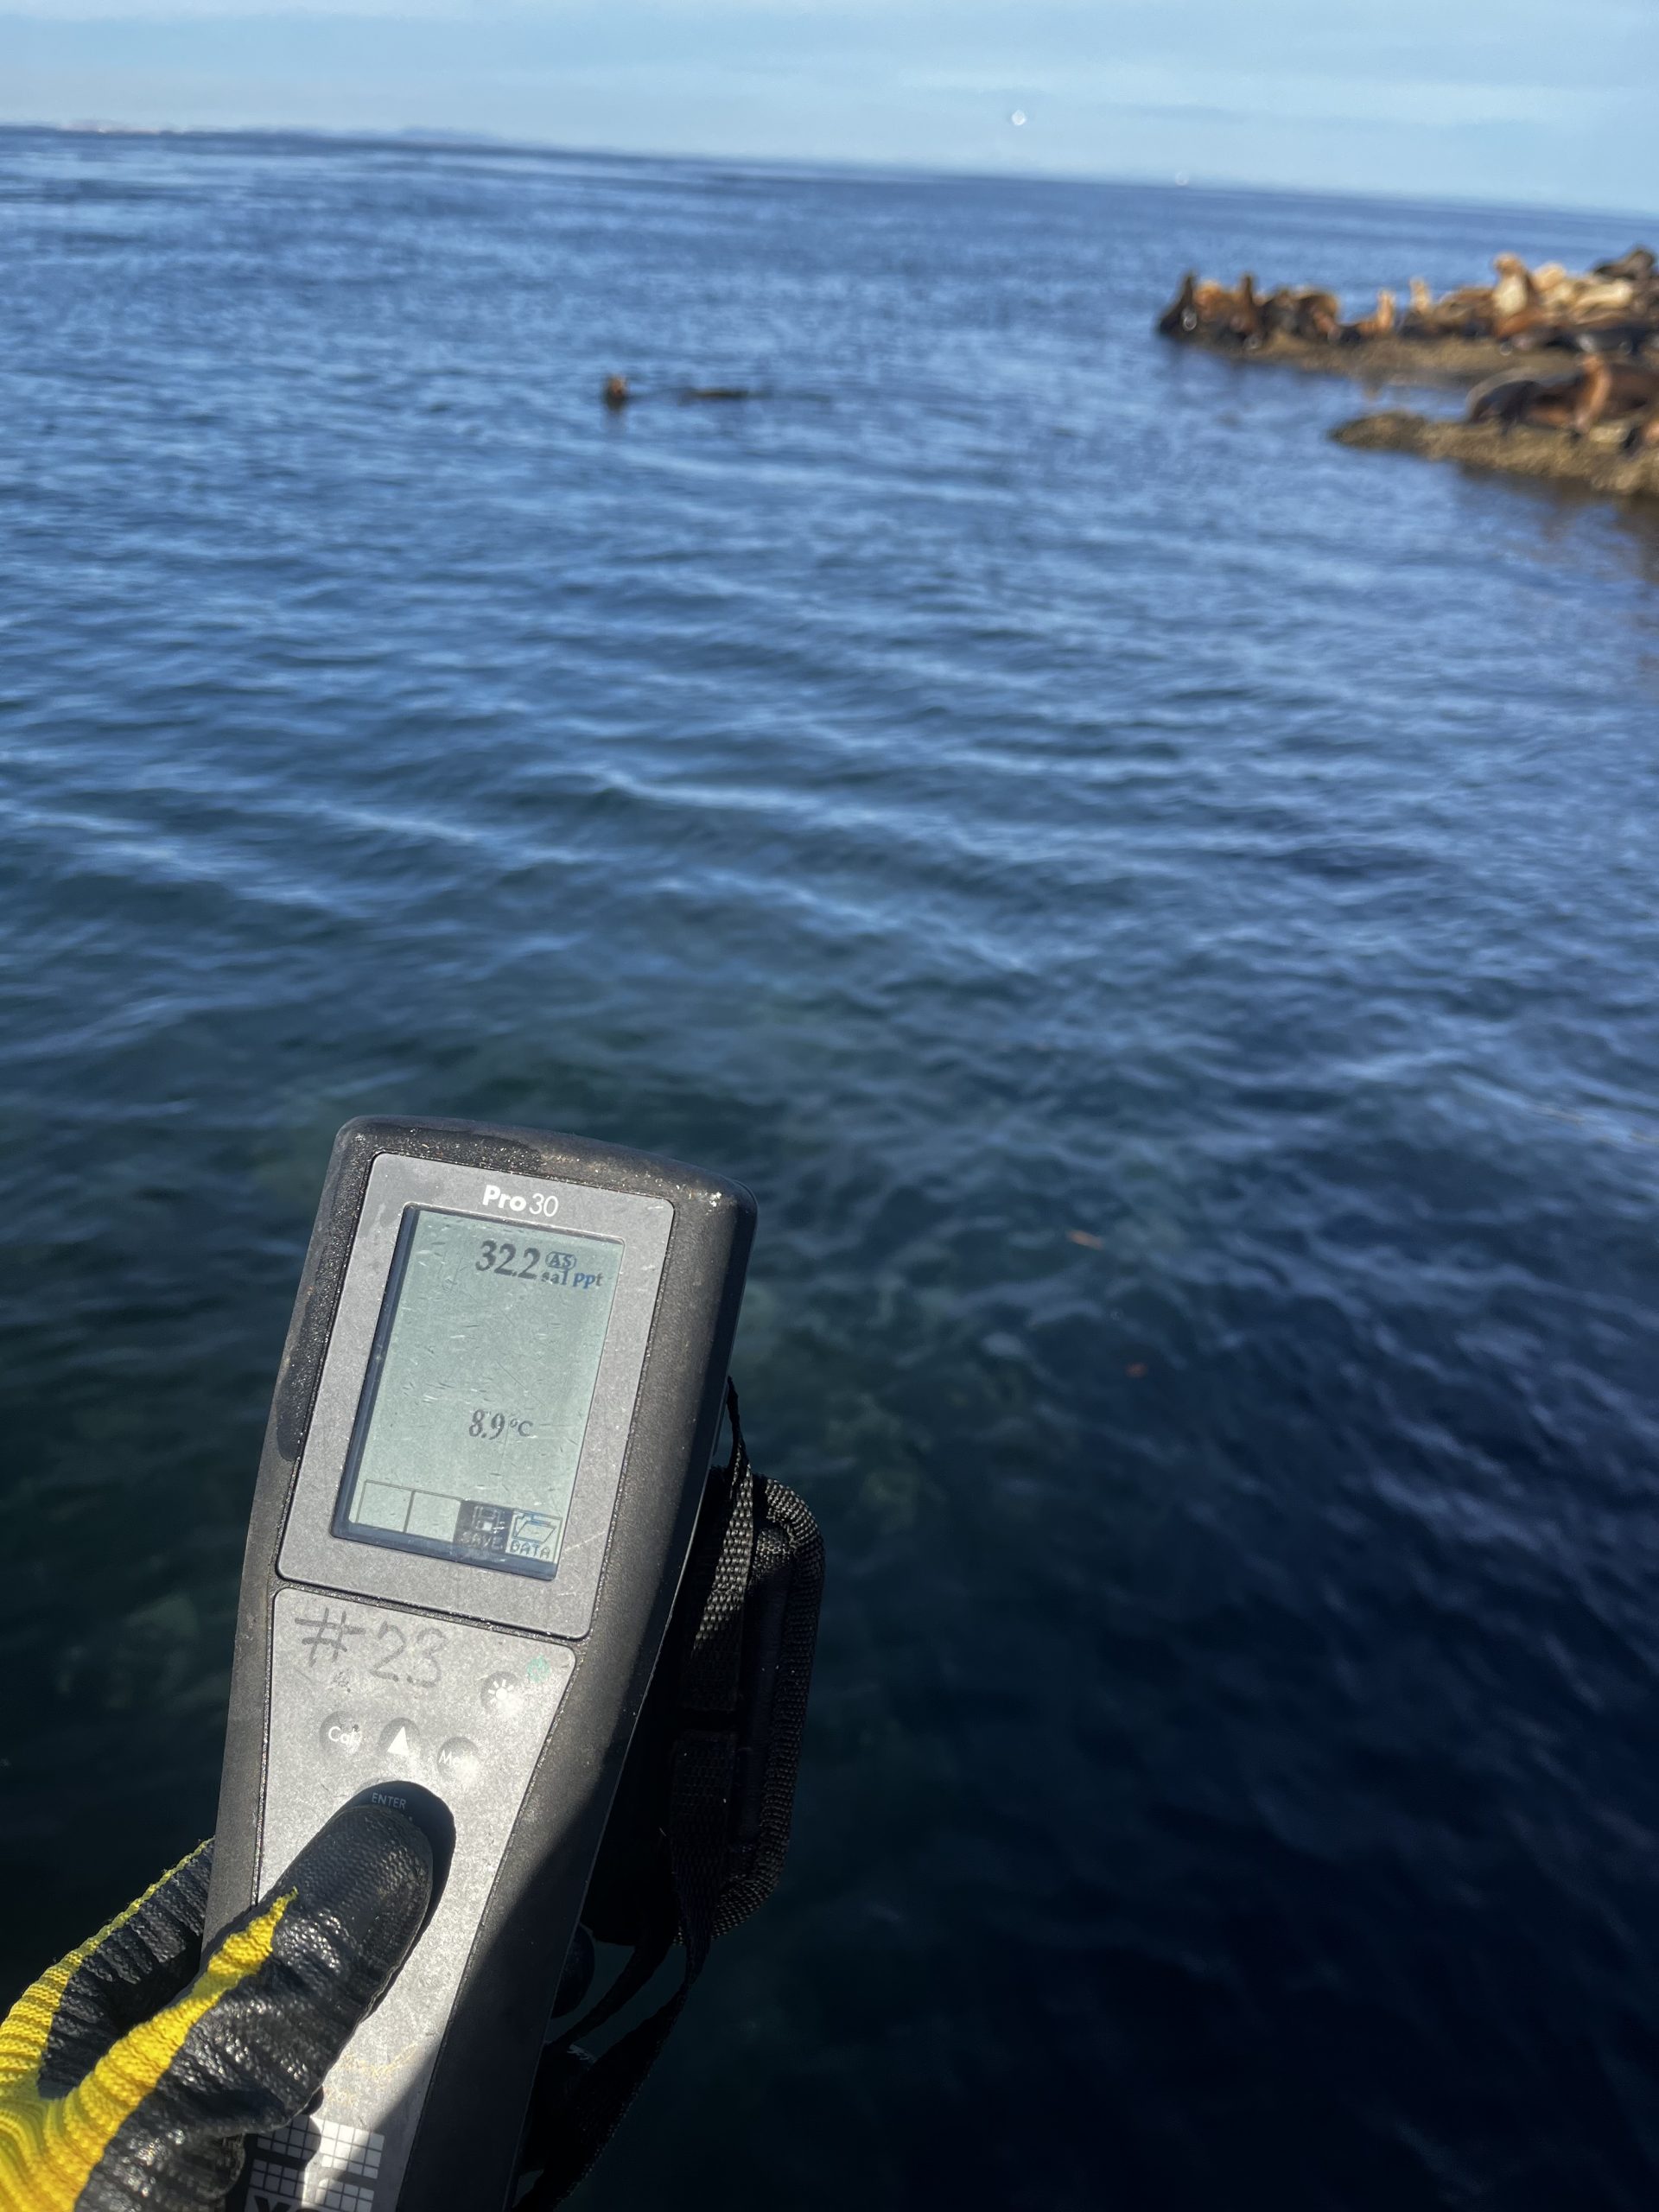
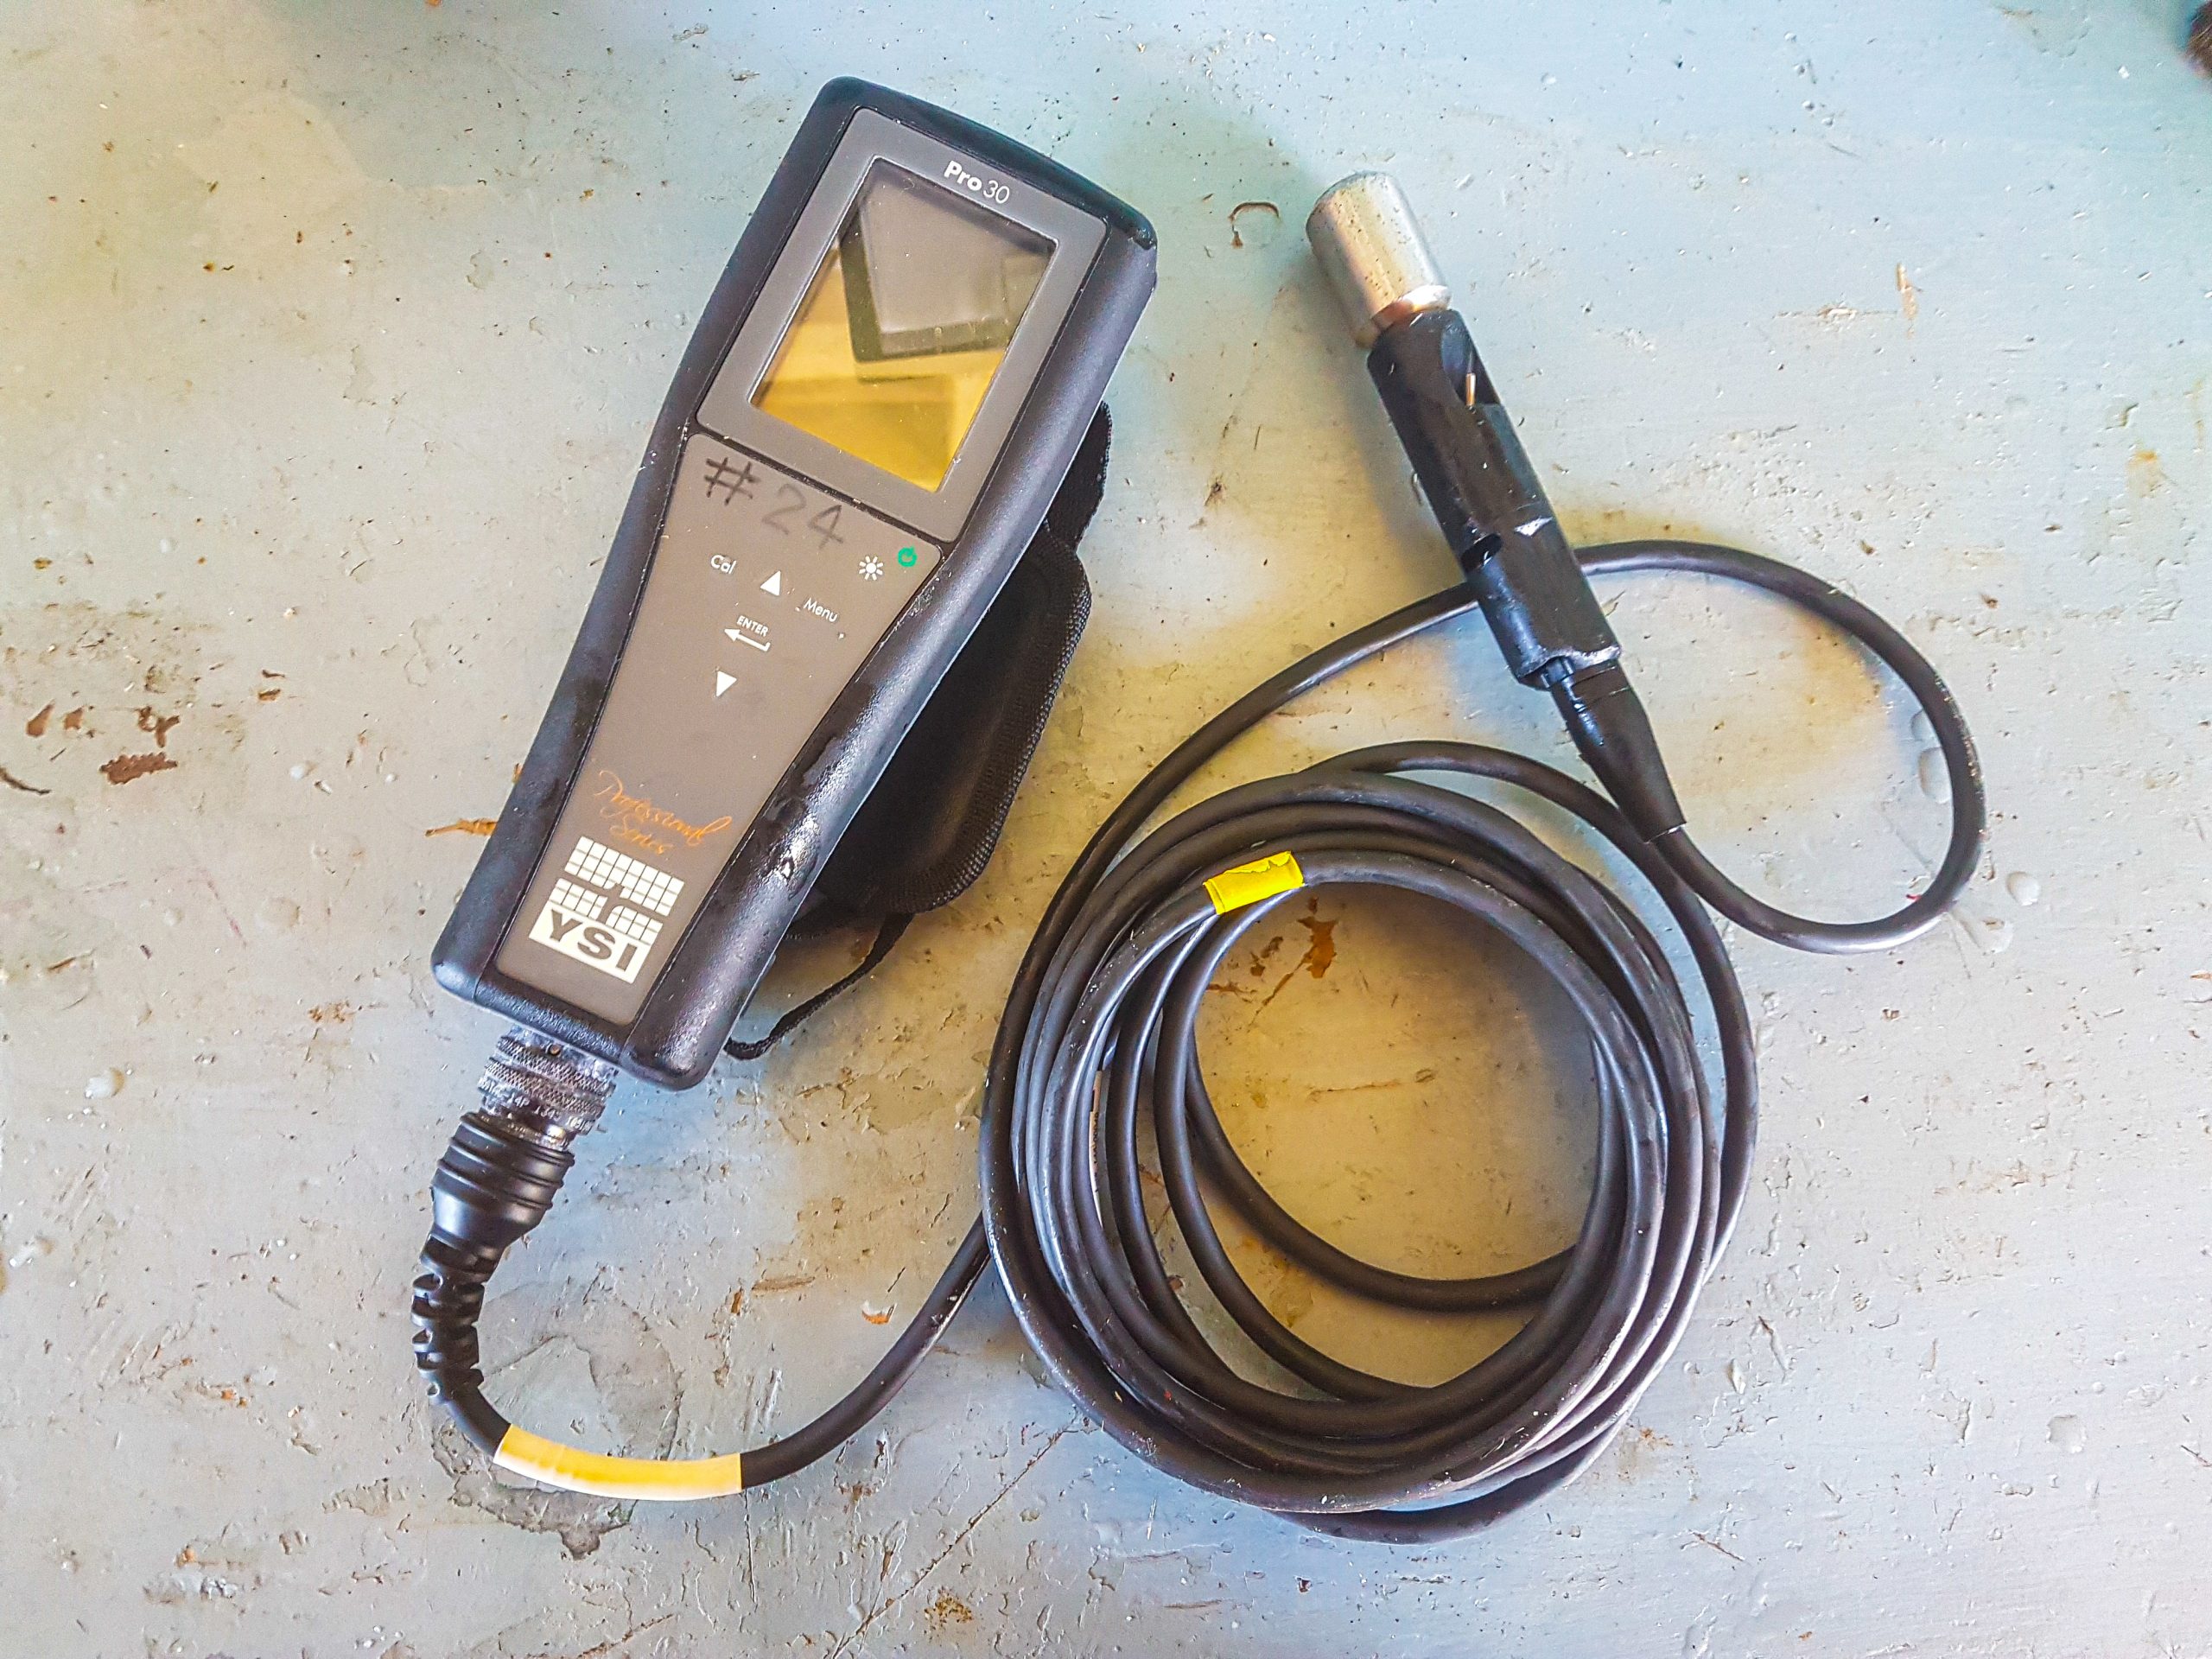
The digital Salinometre
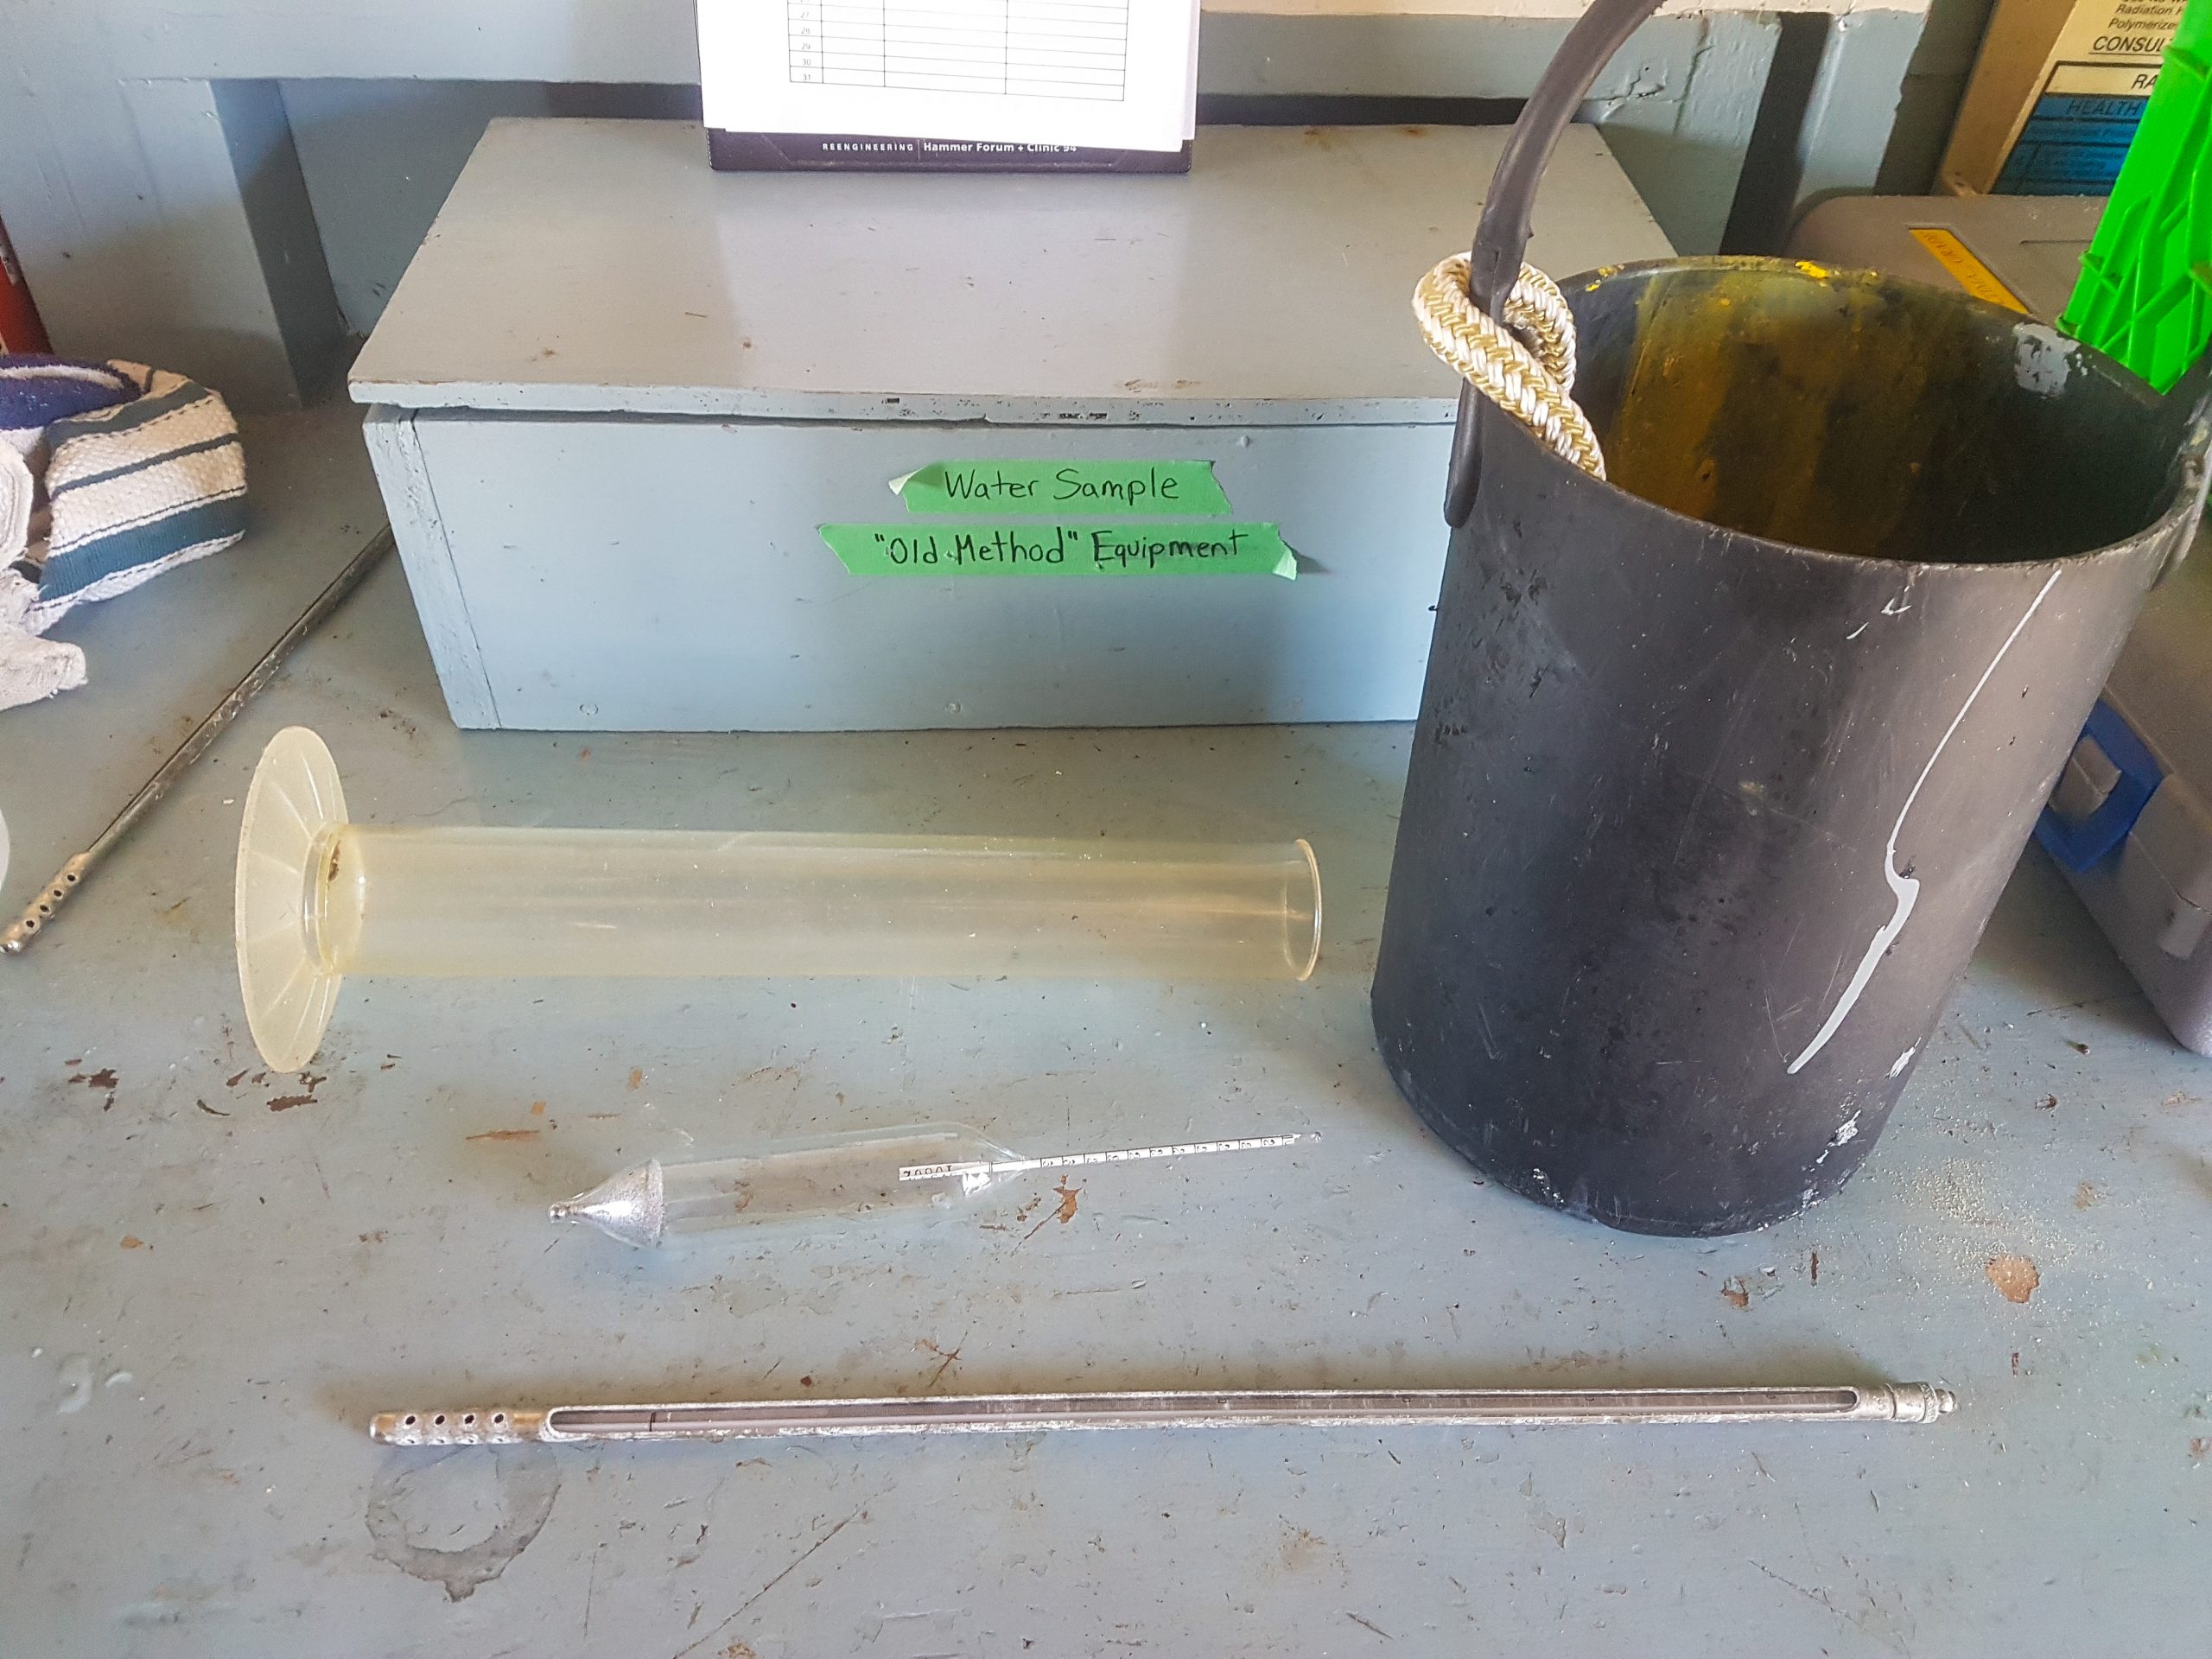
It’s a quick and straightforward process – submerge the probe to a depth of 1m / 3ft, wait for the readings to stabilise, and press ‘Enter’ to save the data. But it wasn’t always thus – and once a month, the Salinometre is calibrated using the ‘old method’ – i.e., collecting water with rope & bucket, transferring it to a beaker on the workbench, measuring temperature and specific gravity, and then working out salinity using the charts provided.
-
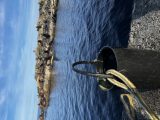
- Sample collection
-
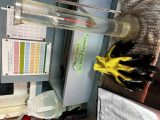
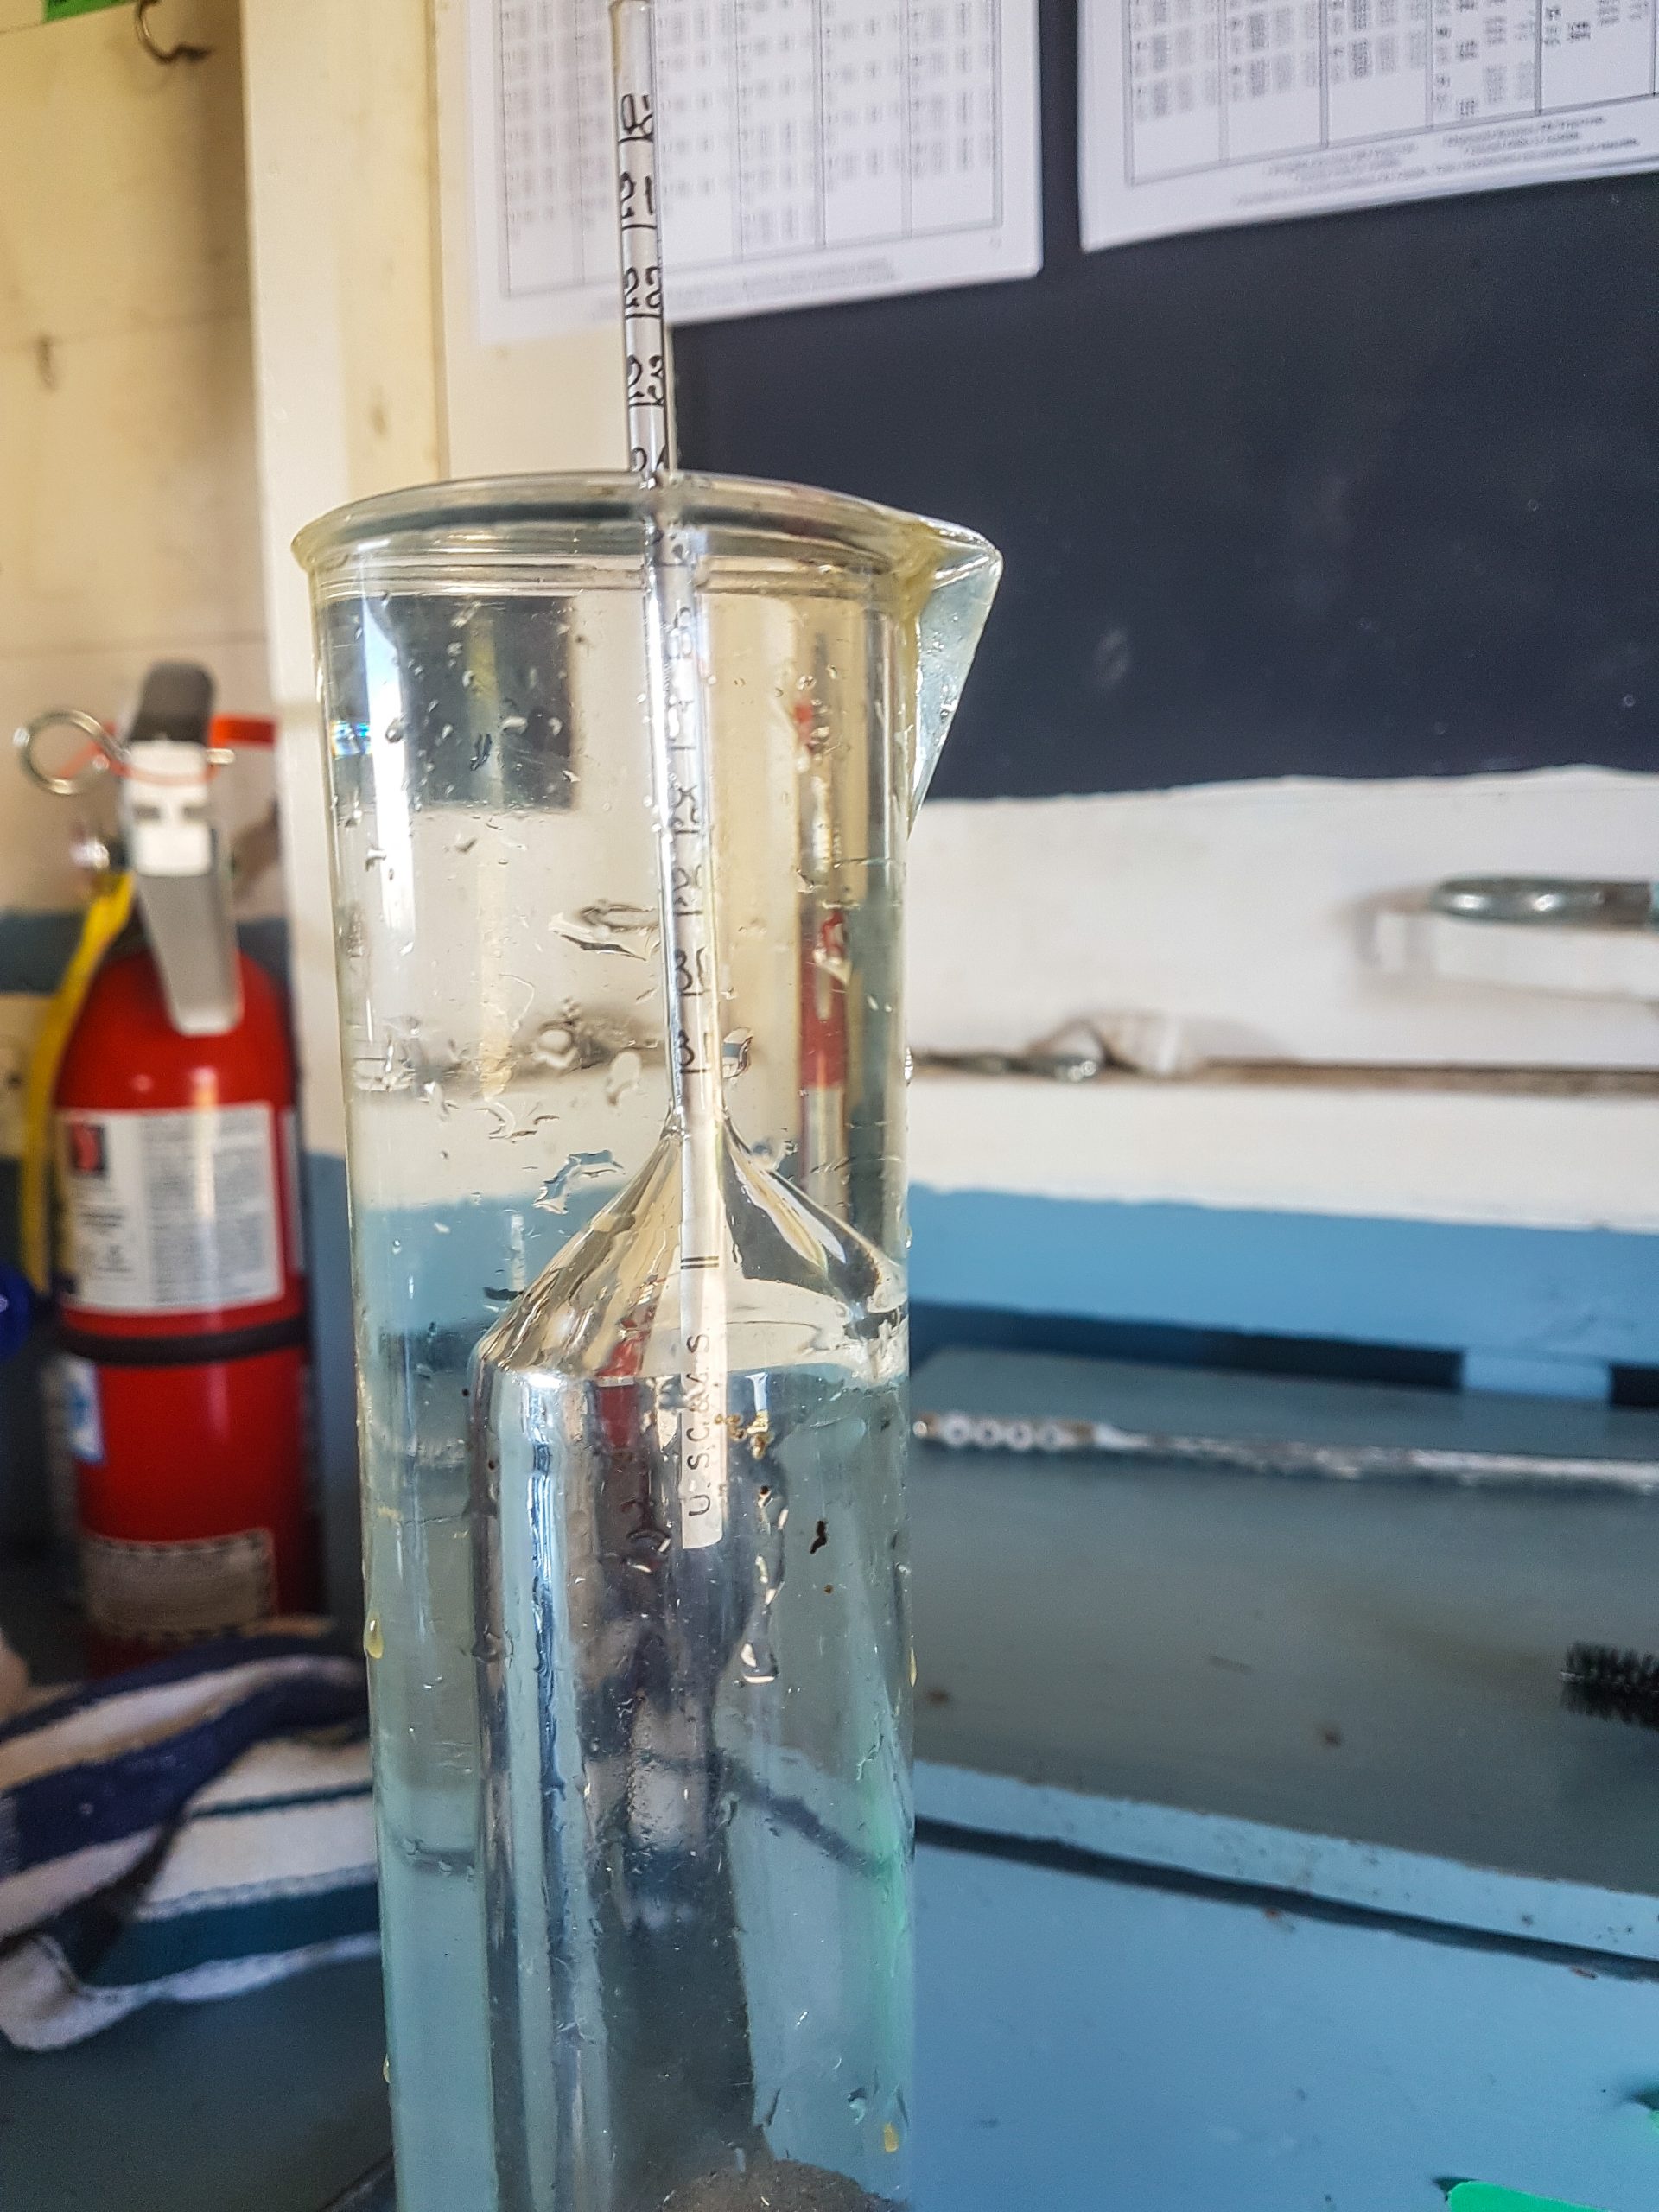
- Measuring specific gravity
It’s a bit more complex than the digital measurement – but always reassuring to see the results align!
______
*or, historically, an hour before high tide
Ecological Notes:
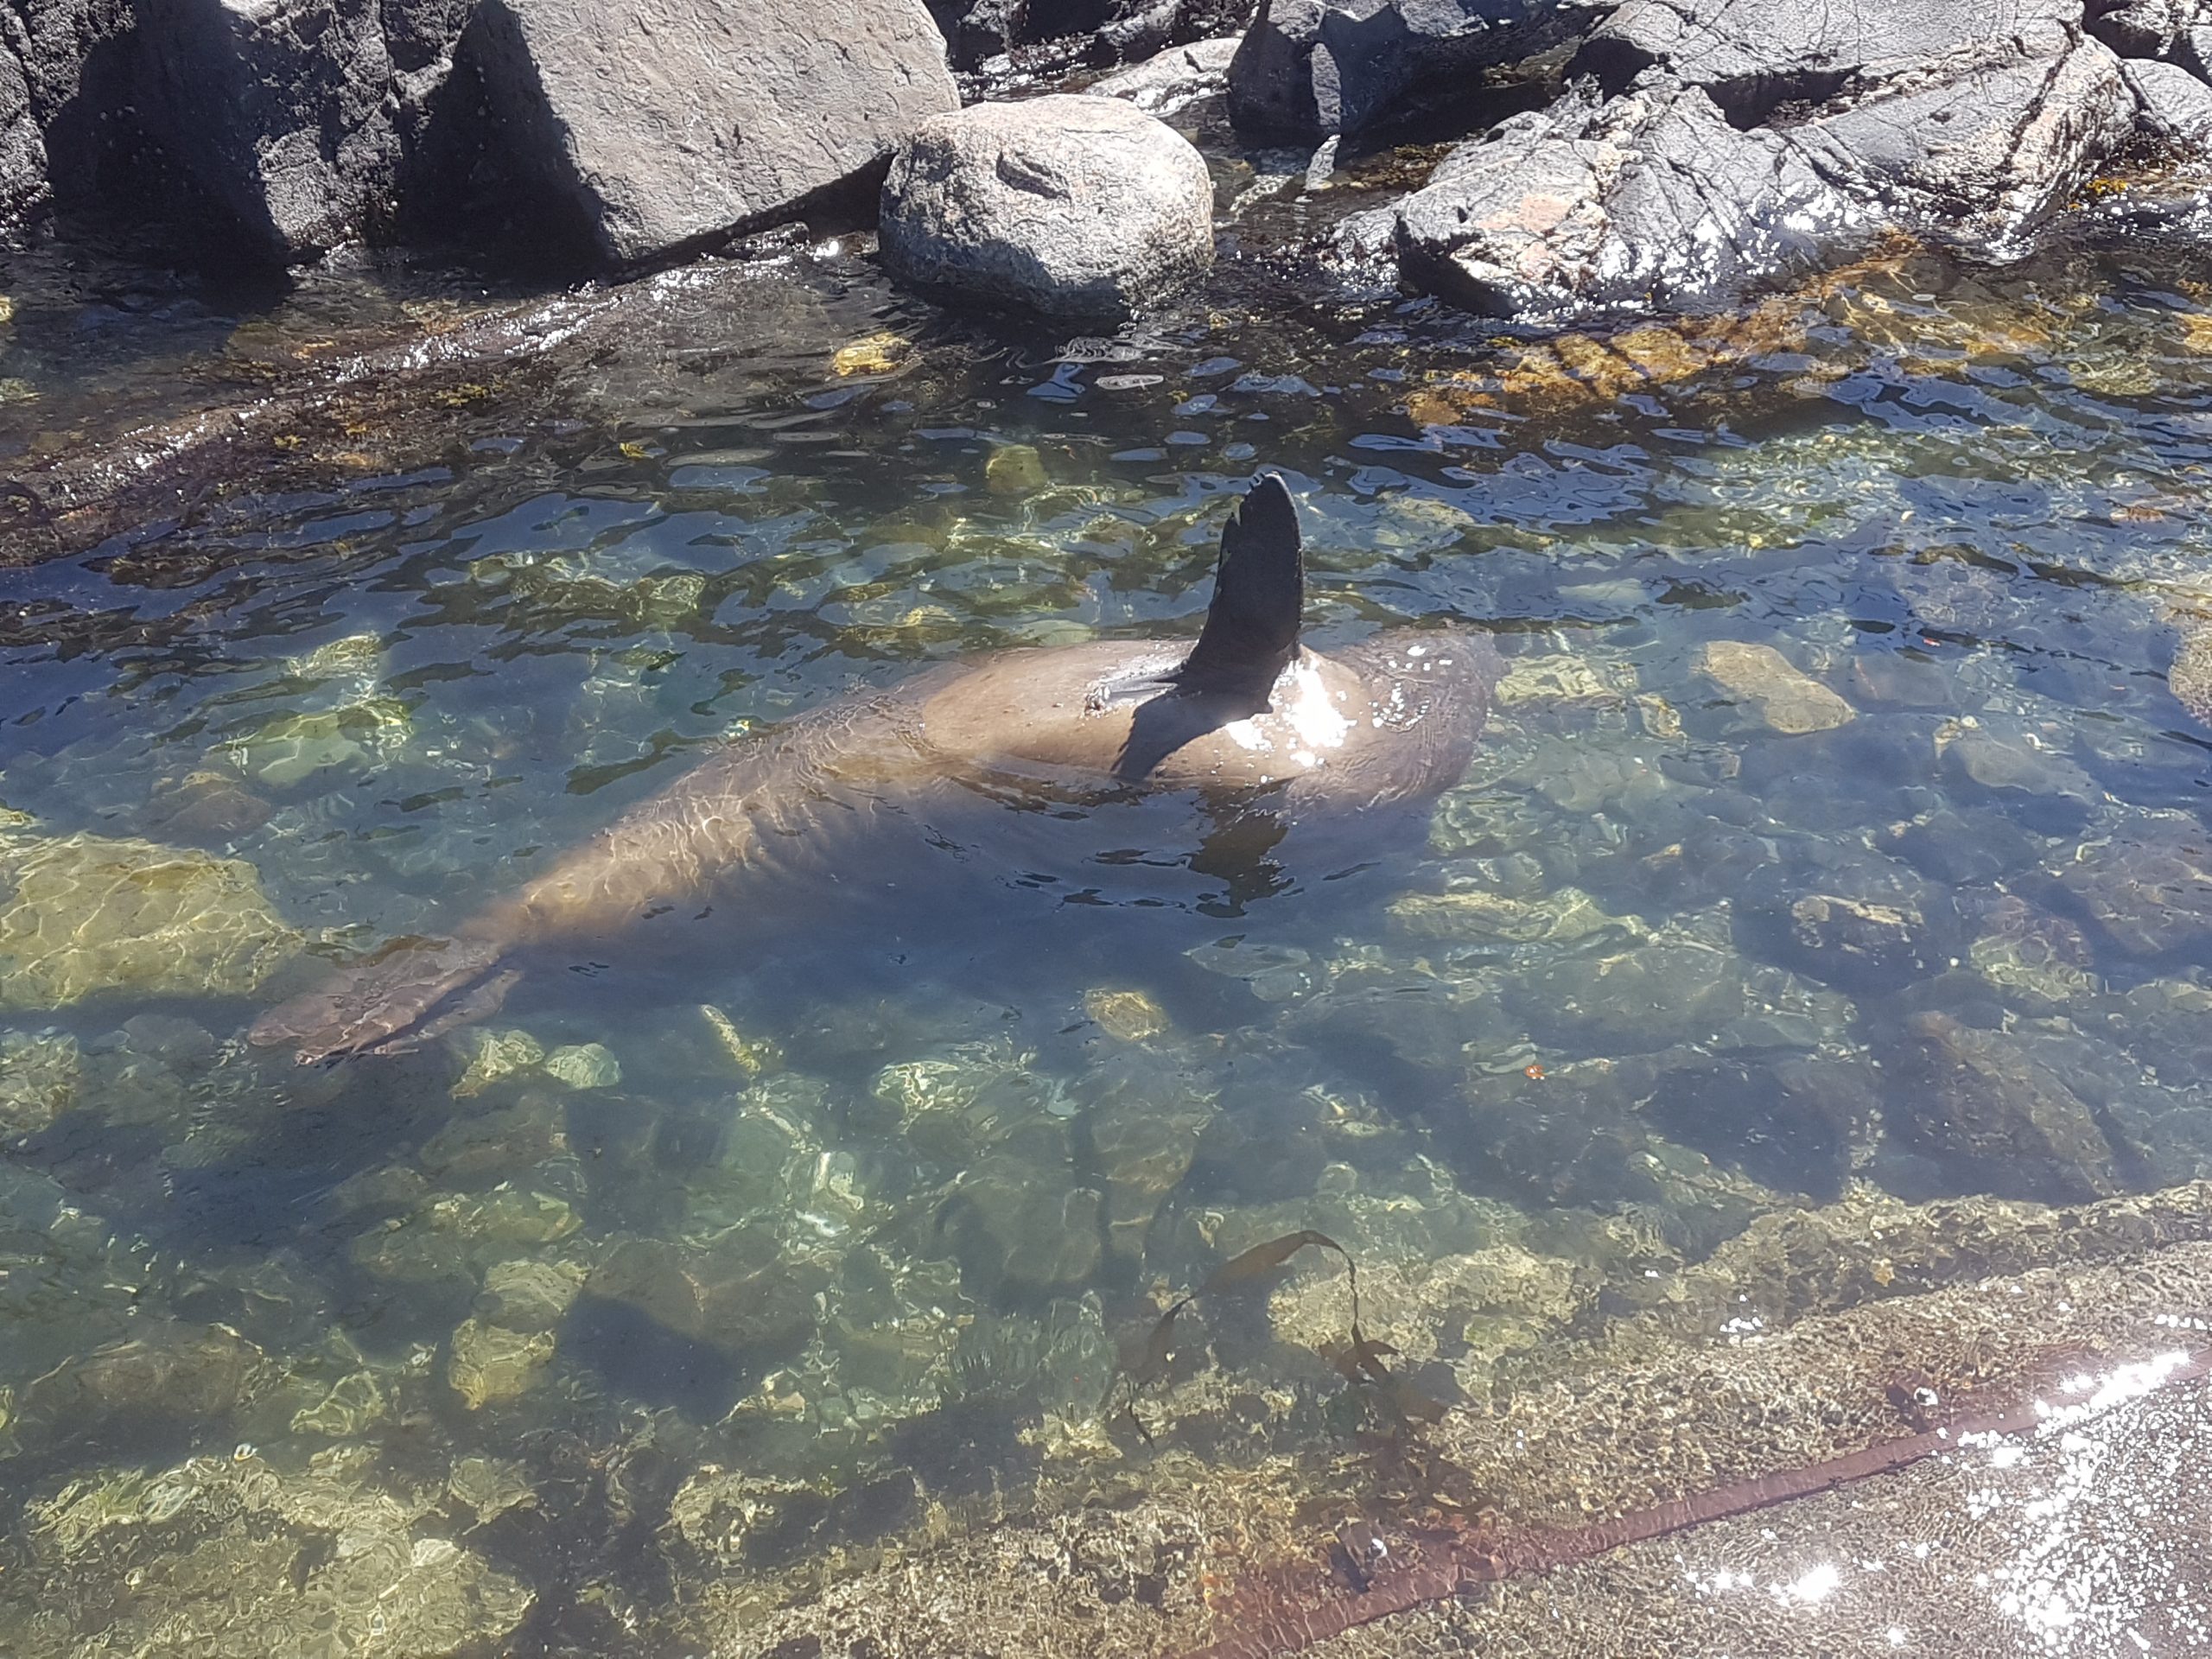
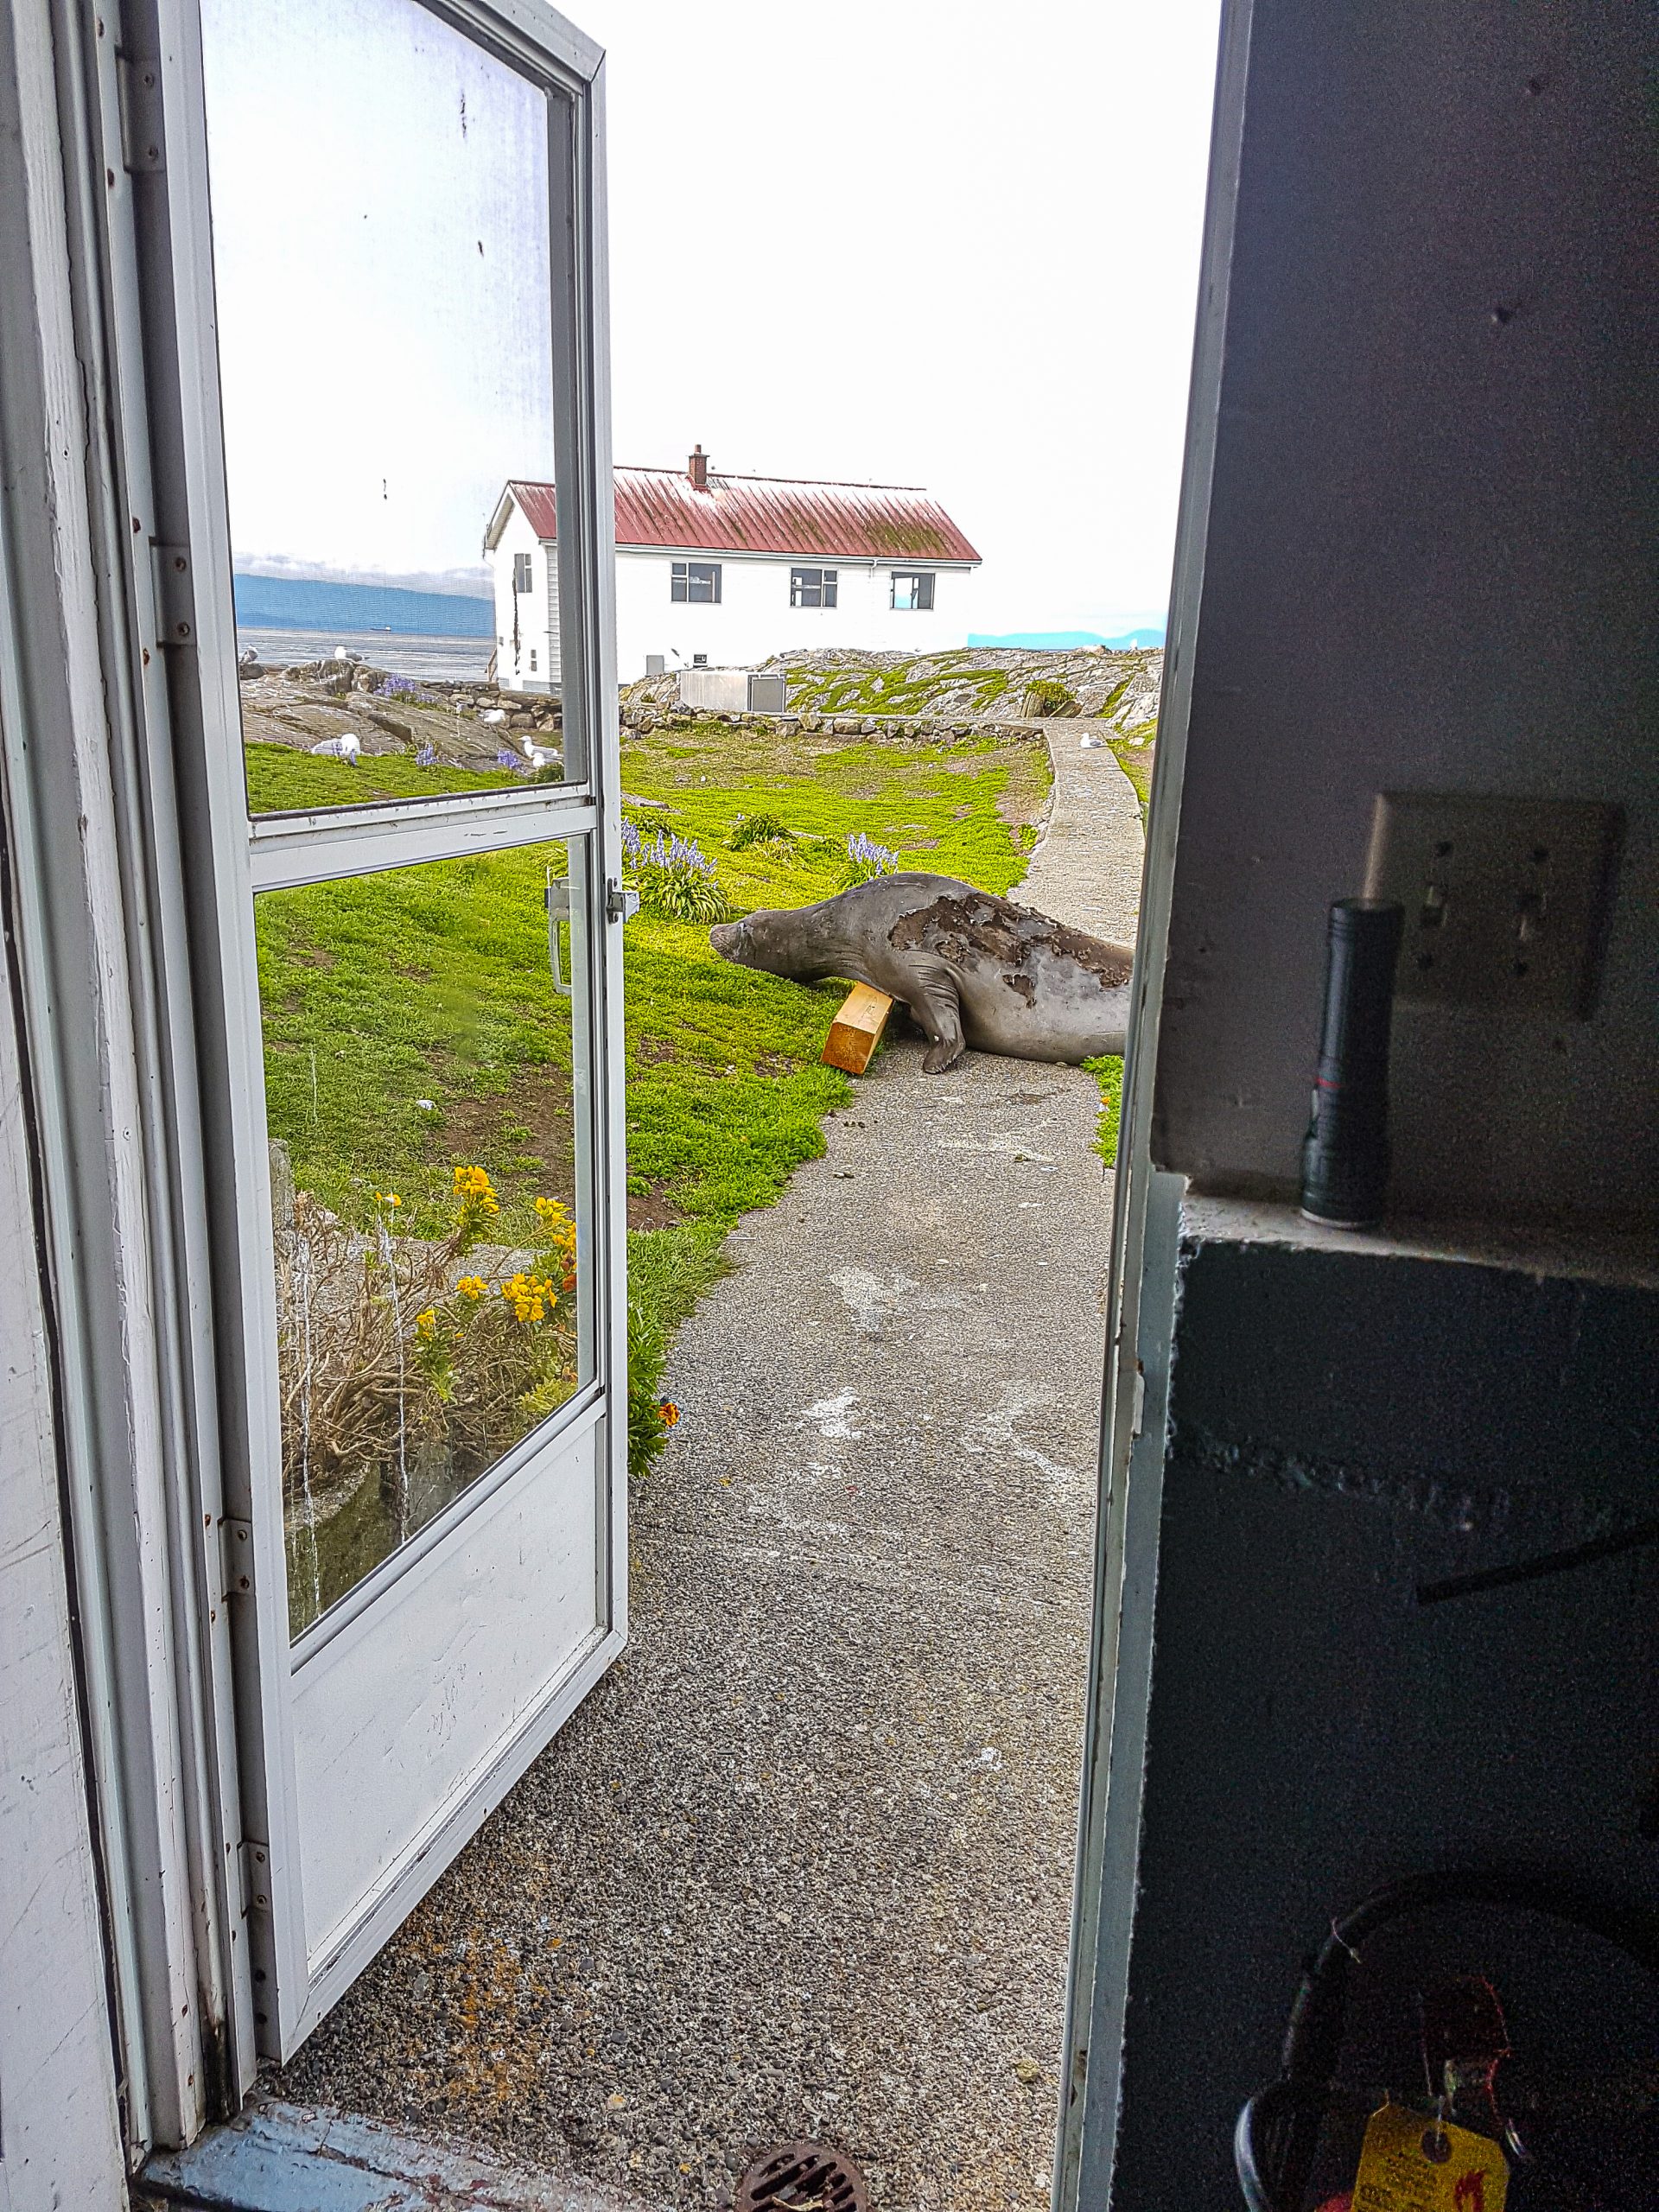
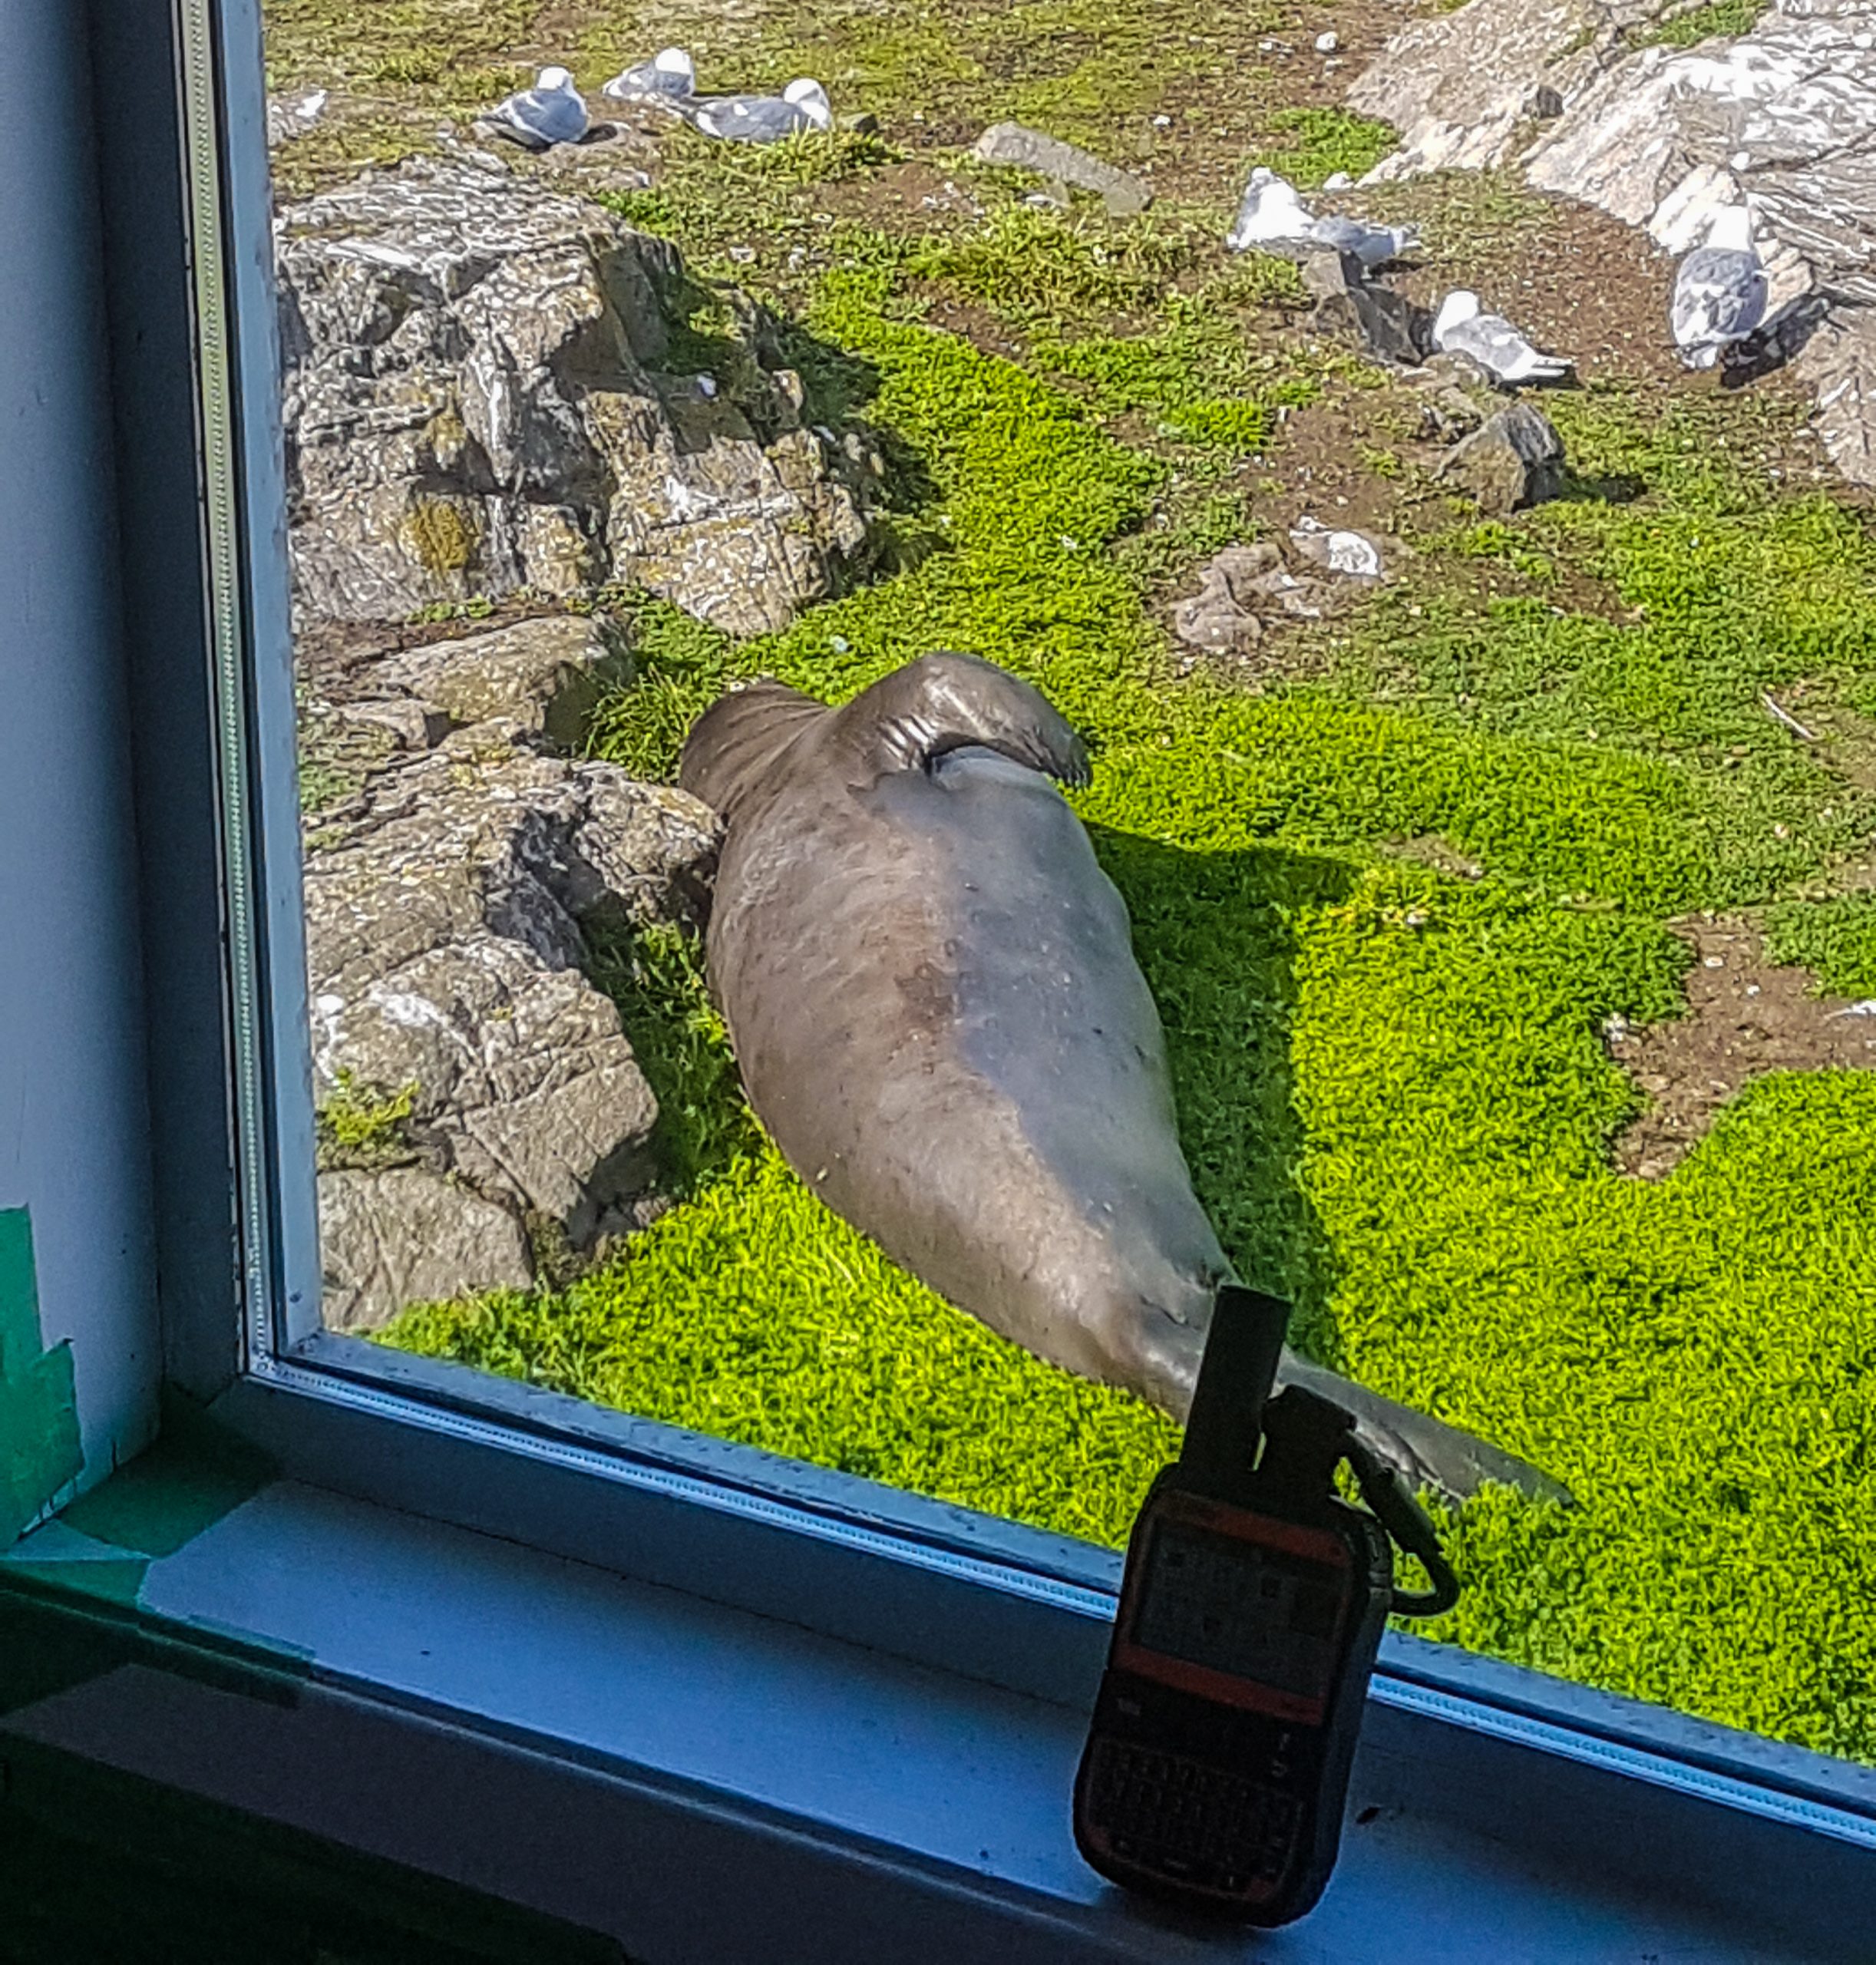
- Sealion numbers continue to increase steadily, with nearly half a dozen naughty ones hauling out on the docks all day
Facility Work:
- Electric fence repairs, esp in SW sector
- Solar panel clean
- Weekly battery water topup
- Pressure washed approx 1/2 of paths
- Desalination
-
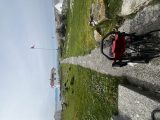
- Before the pressure wash…
-

- The heart of our renewable energy system
Noted Vessel Traffic:
- Numerous ecotourism vessels as the holiday weekend kicks off
- A lone visitor on a jetski – first time I’ve ever seen one in the reserve!
Weather – Current:
http://www.victoriaweather.ca/current.php?id=72
Weather – Past: