Seawater Data : Salinity and Temperature June 2015

Station Race Rocks   Lightstation
Month: June Year: 2015
Observer Lester B. Pearson College   of the Pacific
Date Time Sea Jar Hydro-   meter   No. Observed Density YSI Salinity YSI Temp °C
Temp. Temp.
°C °C
1 17:15 30.8 10.8
2 17:00 30.2 11.1
3 18:05 31.0 11.0
4 18:10 30.8 10.9
5 17:50 31.3 11.3
6 18:15 31.5 11.0
7 missed na na
8 6:07 31.1 9.8
9 21:07 31.1 10.3
10 21:27 30.8 10.3
11 21:07 30.8 10.5
12 20:47 29.6 11.0
13 16:03 30.2 11.2
14 17:00 11.8 12.2 10,802 23 30.4 11.3
15 18:14 30.2 11.3
16 18:00 31.0 11.5
17 18:00 31.1 11.4
18 17:30 31.3 11.1
19 20:32 31.6 10.2
20 21:47 31.5 10.5
21 21:42 31.3 10.7
22 21:40 30.3 11.0
23 21:57 30.6 11.1
24 20:05 30.8 12.4
25 20:00 30.8 11.8
26 20:10 30.6 12.0
27 20:30 30.1 12.2
28 20:45 30.2 12.4
29 21:00 30.4 12.3
30 21:00 30.4 12.2
Means 30.8 11.2

Recorded by Race Rocks Ecological Reserve Guardian for Lester B. Pearson College

Seawater Temperature and Salinity May 2015

Station Race Rocks   Lightstation
Month: May Year: 2015
Observer Lester B. Pearson College   of the Pacific
Date Time Sea Jar Hydro-   meter   No. Observed Density YSI Salinity YSI Temp °C
Temp. Temp.
°C °C
1 14:07 30.3 10.8
2 15:10 30.5 9.8
3 17:02 30.7 9.8
4 18:00 30.9 9.4
5 18:00 31.0 9.5
6 18:00 30.5 9.5
7 18:49 30.7 9.7
8 18:00 30.9 9.8
9 19:10 30.3 10.0
10 18:30 30.9 10.1
11 19:00 31.0 9.6
12 5:40 30.8 9.3
13 9:47 9.7 10 10,802 23.7 30.6 9.7
14 11:42 30.9 9.6
15 11:45 30.7 9.7
16 14:32 31.1 9.4
17 17:27 31.0 9.7
18 18:45 31.4 9.4
19 19:27 31.6 9.6
20 19:27 31.6 9.5
21 19:53 31.6 9.2
22 20:45 31.6 9.3
23 19:21 31.3 10.1
24 20:44 31.1 10.1
25 21:07 31.0 10.1
26 21:15 30.9 10.1
27 10:14 31.0 9.9
28 12:27 30.6 11.0
29 14:00 30.4 10.7
30 16:30 30.3 10.8
31 17:00 30.6 11.1
Monthly means 30.9 9.9
Recorded by Race Rocks Ecological Reserve Guardian for Lester B. Pearson College

Atmospheric Pressure / Barometer at Race Rocks

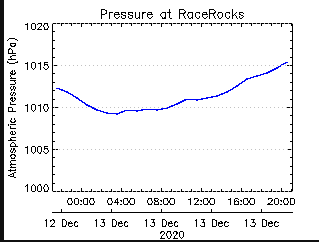
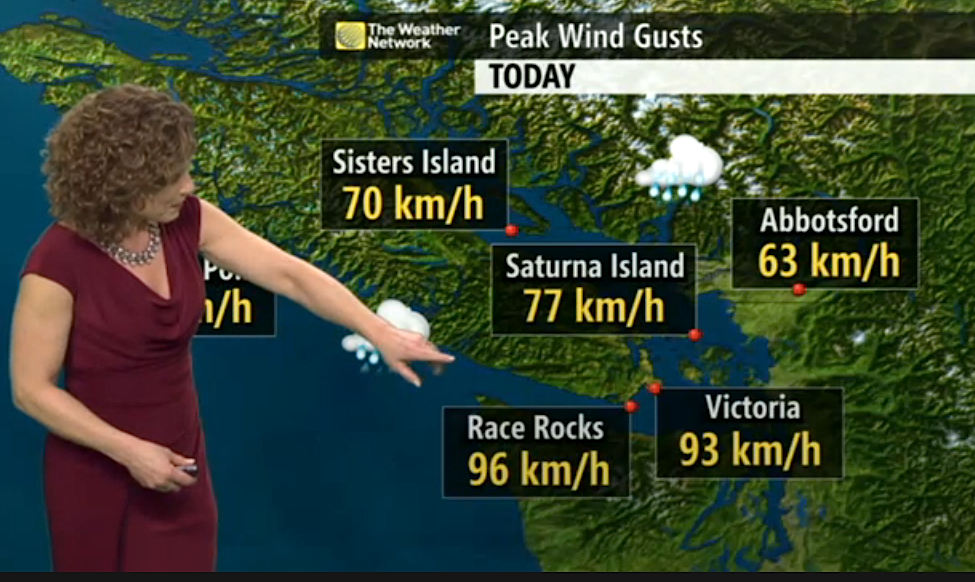
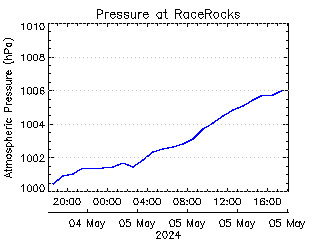
Click for Barometric pressure today at Race Rocks

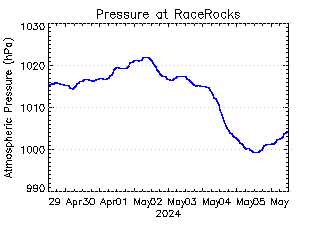
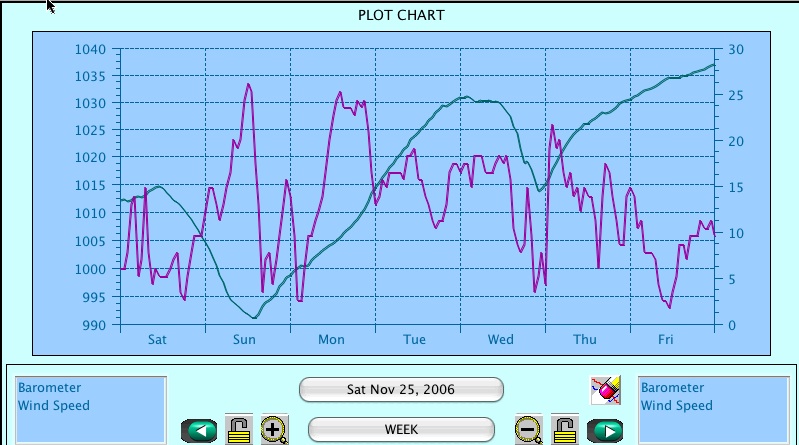
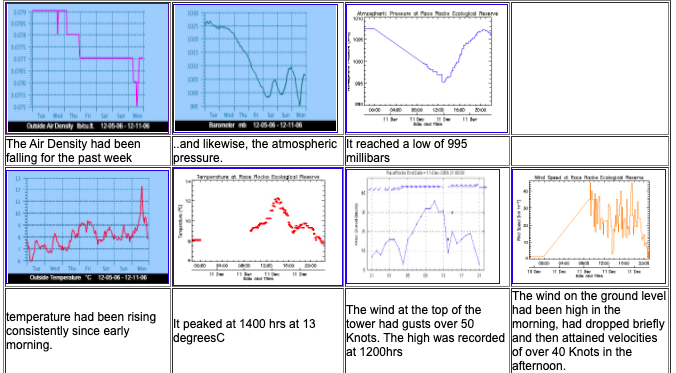
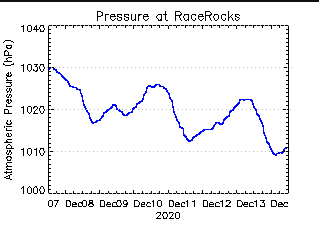
Click for Barometric Pressure for the past week

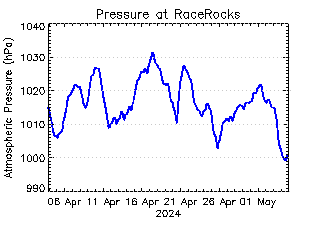
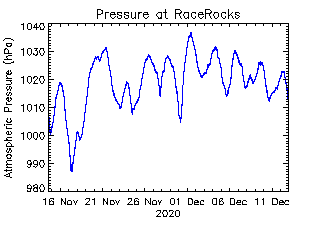
Click for Barometric pressure this past month  


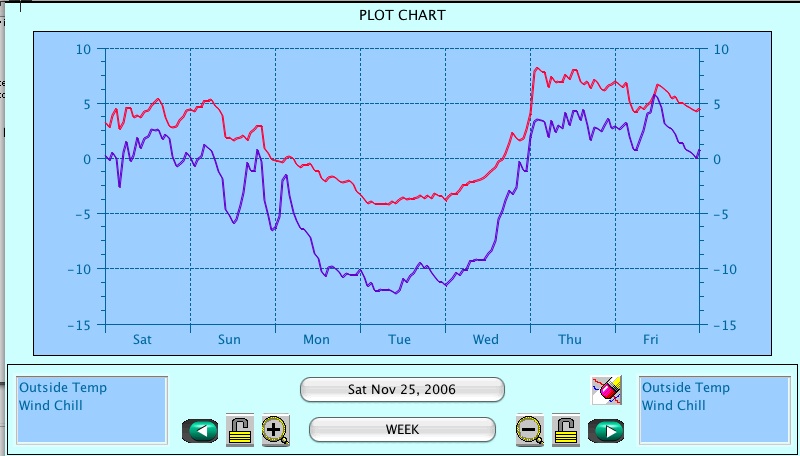
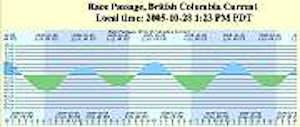
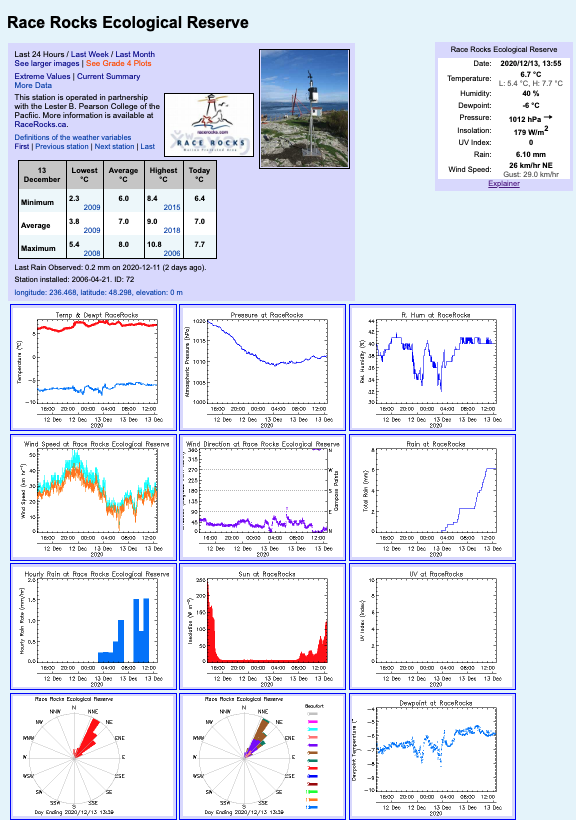
See the barometric pressure, today, last week, last month on the weather page: Our weather instrument is at an elevation  above sea-level of 6 meters.

The weight of the air that makes up our atmosphere exerts a pressure on the surface of the earth. This pressure is known as atmospheric pressure. Generally, the more air above an area, the higher the atmospheric pressure. This, in turn, means that atmospheric pressure changes with altitude. For example, atmospheric pressure is greater at sea-level than on a mountaintop.


To compensate for this difference in pressure at different elevations, and to facilitate comparison between locations with different altitudes, meteorologists adjust atmospheric pressure so that it reflects what the pressure would be if measured at sea-level. This adjusted pressure is known as barometric pressure. Our weather iinstrument  measures atmospheric pressure. Barometric pressure changes with local weather conditions, making barometric pressure an important and useful weather forecasting tool. High pressure zones are generally associated with fair weather, while low pressure zones are generally associated with poor weather. For forecasting purposes, the absolute barometric pressure value is generally less important than the change in barometric pressure. In general, rising pressure indicates improving weather conditions, while falling pressure indicates deteriorating weather conditions. Our weather instrument samples the barometric pressure at the time of the archive and writes that value into the archive memory every 10 minutes.

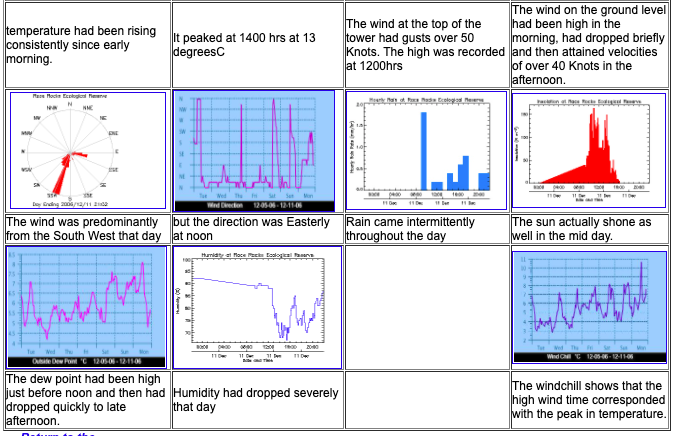
It makes an interesting esercise and one can get a good understanding of negative correlations when comparing the records for wind speed and barometric pressure for several days or the past month

The affect of Barometric Pressure on Organisms at Race Rocks

Response of organisms to Barometric Pressure:

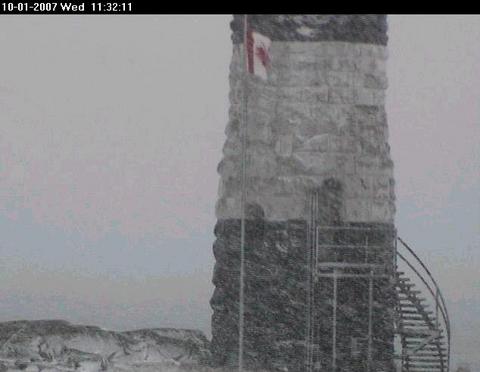
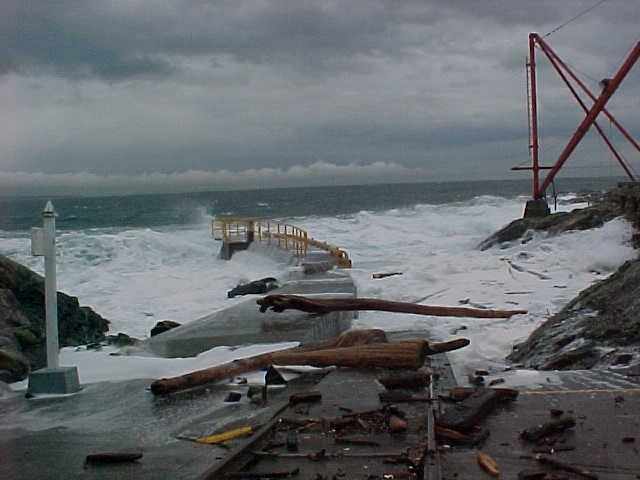
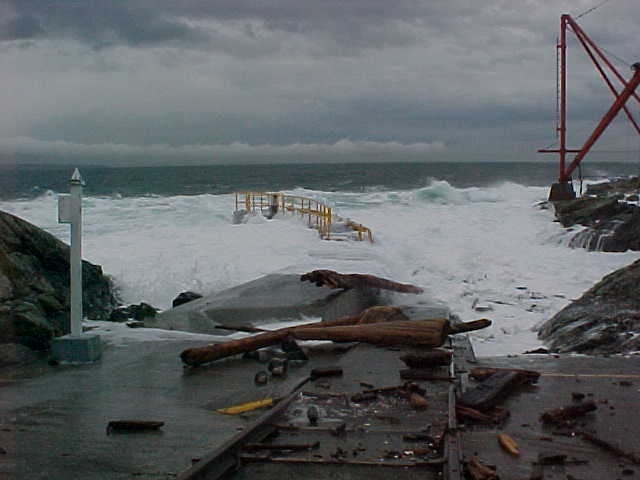
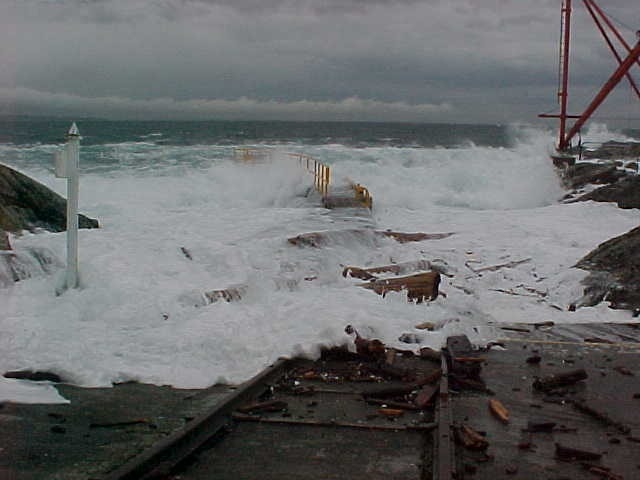
There is little quantitative evidence that the organisms of Race Rocks respond directly to changing barometric pressures. However, it is to be noted that most birds possess a sensory organ that does respond to changing pressure. An organ in the middle ear called the Vitali organ or the Paratympanic Organ detects pressure changes, warning them to take cover before a storm arrives. Birds will also interrupt migration when there is a hurricane approaching. It is also obvious that changes in wind patterns, so closely tied to changing barometric pressure, influence foraging patterns, social interactions and timing of activity. See this file for an example of a snow storm when there were no birds at Race Rocks. The overwintering populations of gulls and cormorants were back the next week.

Research Idea: Track barometric changes at Race Rocks, and do behavioural observations using the remote control camera. Try to find out if there is a correlation between a rapidly changing pressure and bird behaviour. Things to control for in your study:

 Temperature and present wind conditions ( velocity and direction).
Research elsewhere has shown that Bats are the only mammals that respond to pressure changes, because they also have a Vitali organ. See the quote below: “BAT BAROMETERS SIGNAL MEAL TIME” By Sean Henahan, Access Excellence “CHAMPAIGN, Ill. –

Bats appear to use a built in barometer to determine the chances of a good nights bug hunting, according to a study by Ken Paige of the University of Illinois Institute for Environmental Studies. Paige spent nearly a year monitoring the dining habits of a colony of eastern pipistrelles, a cave-dwelling bat commonly seen in western Illinois. He found that the bats emerged in larger numbers when barometric pressures dropped and insects were numerous. He noted that the number of insects declined dramatically and that fewer bats left their roost when air pressure increased. Indeed, barometric pressure alone explained 87 percent of the variation in bat activity, he noted: “My research strongly suggests that the eastern pipistrelle uses barometric pressure as a cue for predicting the relative abundance of aerial insect prey outside their roost. Barometric pressure is the only physical environmental cue available to a bat roosting deep within a cave. All other variables such as light, temperature, relative humidity and wind currents are virtually constant. When air pressure is low, aerial insects are abundant, and bats respond by leaving the roost to forage.” The bats built-in barometer is likely to be its Vitali organ, a middle-ear receptor that is thought to help birds measure air pressure. Bats are the only mammals to have such a sensory organ. Paige’s bat-watching also showed that bats track barometric pressure metabolically. When the barometer fell, the bats slowed down their metabolisms, allowing them to conserve energy. By doing so, they can delay or eliminate the need for entering torpor, a sluggish state of dormancy that makes them susceptible to predators. In addition, the bats’ tracking of metabolic pressure may function as a bet-hedging strategy, he said “When pressure is low, insects are most abundant, except during heavy rain,” he said. “Because it is unlikely that bats can detect the rain from deep inside a cave, they have to fly out of the roost to check. This is no problem, however, because at low pressure they already are running on an economy setting and will waste minimal energy if they find their trip to the outside is a waste of time.” Because they already are conserving energy, he added, they can extend the benefit of their previous meal. Thus barometric-pressure tracking can be viewed as an alternative evolutionary strategy to torpor, he explained. This results of this research project appeared in the June issue of the British journal Functional Ecology.”.

Accessed January 2014: at:  http://www.accessexcellence.org/WN/SUA06/batsense.html


Snow as an Abiotic factor at Race Rocks

Every few decades, Victoria receives very large snowfalls, including the more than 100 cm (39 in) of snow that fell in December 1996. On the other hand, roughly one third of winters will see virtually no snow, with less than 5 cm (2 in) falling during the entire season. When snow does fall, it rarely lasts long on the ground. For Victoria Harbour, the climate records report annual mean snowfall totalling 29.3 cm ( about a foot) falling on 8 days..The Environment Canada website lists Victoria ( Airport ) as the city having the fewest snow days of all cities in Canada (10) The mildest winter (7.4 degrees average) and the lowest snowfall (43.8 cm.)The headlines in the Victoria Times for November 27, 2006 read :

“Snow shutdown
Schools closed, buses delayed
Victoria Times-Colonist
Published: Monday, November 27, 2006
Snow has shut down much of Greater Victoria.
Public schools in Saanich, Victoria and Sooke are closed, as are many private schools and the region’s major post-secondary institutions, including University of Victoria, Royal Roads University and Camosun College. “

The snowstorm of November 26, 2006 can be traced from the Victoria harbour data on the Environment Canada website. Here it can be seen that the snow started on the morning of November 26 and continued until early morning of the next day. It snowed again midday on the 29th of November . The temperature that week took an unseasonal plunge.

On Race Rocks our weather station recorded the windchill from the North East pushing the temperature down to minus 13 degrees Celsius

The blue bar represents rainfall, with the scale in mm.on the left. The green line is humidity. After Sunday, the freezing temperature prevented the instrument from registering rain. for several days. Due to blowing snow, it is unlikely that all snow that fell was measured..

Wind speed is the purple line, and barometer is the blue line. Note how the barometer plunged just as the snowstorm started. The wind remained high for most of the week. This graph represents the surface wind profile. At the top of the tower it averaged 10-15 knots higher.

THE ABIOTIC EFFECTS OF SNOW:

Our second snowfall for the year arrived on January 10, 2007. PB took this photo for us. This was unusual for Victoria as we had been smuggly assuming that we had already had our share of snow that stayed for a week for the winter.

No research has been done at Race Rocks on the effects of snow on the animal and plant life other than the observation that the birds disappeared while these severe storm events were in progress. It is also almost impossible to access Race Rocks during a snowstorm since the wind blows in from the north-east and the exposure at the jetty prevents a boat from landing.


See the exercise on the water cycle

This image from the webcam in the November, 2006 snow storm showed a bleak landscape, with no seagulls in the usual spot. In a week they had all returned however, as mild temperatures returned.

The topic of SNOW ECOLOGY has not been extensively studied. One of the classic works on the topic was done by William Pruitt of the Department of Biology at the University of Manitoba.
This paper is available from the TAIGA BIOLOGICAL STATION THESES AND RESEARCH PAPERS
( Formozov-inspired Concepts in Snow Ecology in North America. Bulletin Moscow Society of Naturalists, vol.104, No.3:pp.13-22. William 0. Pruitt, Jr.)

Records of snowfall from 1985 to February 1996 may be found on the Environment Canada Website Search that website for total snowfalls during that period click on British Columbia/advanced search/ then enter Race Rocks in the Search by Station Name section. Use the pull down menues to find the year, month or day of interest

In nearby Metchosin, by November 27, 2006, over 40 cm of snow blanketed the forests and farms. A week later, the snow had all but disappeared. Considerable damage to tree branches was sustained during this snowfall.

Artificial Tidepool #13 peg #5

The rockwork done to seal the southern entrance

This artificial pool was made under permit from BC Parks by Mike Slater and Garry Fletcher in June, 1999. It is part of a long range succession study.
See also below for “AFTER the HURRICANE”

AFTER THE HURRICANE OF DECEMBER 15, 2006  (newspaper item)

Wind at Race Rocks

This video was taken with the remote camera 5 on Dec 11, 2006, a day which can be represented by the images of the atmospheric factors below. Note the wind speed was over 40 knots in the afternoon. The extreme pressure drop on the barometric graph was a good indicator that a big wind was coming.

It certainly can be seen as a wild mixture of weather for the day.


Geology of Race Rocks


TOPOGRAPHY of SUBTIDAL RACE ROCKS

 Topography of Subtidal Race Rocks

Only by looking beneath the waves can we really get a full picture of the extent of the topography of the Race Rocks Archipelago. We were fortunate in 1999 to have a comprehensive study and mapping project done by the Canadian Hydrographic Service. They used multi- beam sonar to plot the bottom profile down to 150 metres.


With the results of this imaging process we are now able to appreciate the extensive powers of the glaciers as they moulded the terrain at the Southern tip of Vancouver Island. Now, the only surface features that attest to this force are the glacial scouring on the rocks and the erratics, (rocks of basalt or conglomerate) left by the last glacier to pass over Race Rocks and the adjacent shorelines of Vancouver Island.


The Abiotic effect on Organisms of the Surface Topography of Race Rocks


Go to this Google Map of the Surface topography of Race Rocks to see how the abiotic factors of geology and topography affect the distribution of organisms at Race Rocks

AND THE GEOLOGY IS EVER-CHANGING

This large boulder at one end of the artificial tidepool moved 2 metres during the Hurricane of Dec 15, 2006. See this file for before and after pictures.


THE QUARTZ INTRUSIONS:
We have very little formal information on the Geology of Race Rocks, but no doubt it has an important role to play in the distribution of organisms. Most of the foundation rock at Race Rocks is a black coloured basalt. It was formed underneath a volcanic range which has since been scoured away by glaciers. One obvious example to which we often refer students on field labs is the interesting rock structure of the bottom of tidepool number 4 on the west intertidal shelf of Great Race Rock. On the this side of the island, many seams of white rock occur as intrusions into cracks of the previously hardened basaltic background rock.


On the bottom of this shallow pool is a seam of quartz with some obvious crystalline structure.. In the tidepool we find a pure white variant of the usually black coloured Littorine snail, Littorina sitkana( periwinkle) We speculate on the existence of this color variant being due to the quartz background which makes it well camouflaged in the pool and thus able to avoid the predation of shorebirds. In the picture several white and several black variants of this species are shown against the quartz background.

In 1998, a Pearson College student, Giovanni Rosso, conducted research on this color variation and produced a paper on shell colour variations at Race Rocks. In his abstract he summarizes:

“As with most intertidal gastropods, Littorina sitkana shows remarkable variations in shell color. This occurs both in microhabitats which are exposed or sheltered from wave action. There seemed to be a close link between the shell coloration of the periwinkle and the color of the background substrate. Field work was carried out on the Race Rocks Marine Protected Area in order to investigate patterns of color polymorphism. Evidence from previous studies was used to support interpretations and understand certain behaviors.
The results showed that in the study site there was a very strong relation between the shades of the shells and the colors of the rocks. Light colored shells stayed on light shaded rocks and vice versa. An interesting pattern was noticed with the white morphs. These were rare along the coast (only 2%), but were present in relatively high numbers in tidepools of white quartz. From previous experience (Ron J.Etter,1988), these morphs seem to have developed as evolutionary response a higher resistance to physiological stress from drastic temperature changes between tides. Some results showed that the white morph is present in an unexpectedly high percentage at the juvenile stage, but then their number decreases dramatically.”

APPEARANCE of CONGLOMERATE SUBTIDALLY.

An interesting discovery was made in 2005 on the preliminary dives to examine the substrate where the tidal current generator was going to be installed, The bottom at location 1, just North of the docks at Race Rocks, yielded a conglomerate type of rock surface at 15 meter depth in the channel . We were surprised at this as we had never come across this formation before, certainly it doesn’t appear to exist on the rocky islets, above water on the archipelago. Dr. Chris Yorath who has recently published a new version of “The Geology of Southern Vancouver Island” has supplied the following information which may explain this finding:


1. Race Rocks are part of the Metchosin Igneous Complex and is part of the Crescent Terrain (25 million years old).

2. Conglomerate rock overlays the igneous rocks although it has been eroded away in many places.

3. The source of the “boulders” within the conglomerate is often from within the Metchosin Complex but there may also be sources from other parts of Vancouver Island.

This large glacial erratic boulder made of conglomerate rests on the shoreline 50 metres east of Fossil Point. in nearby Pedder Bay.

4. The conglomerate is called Sooke Conglomerate and can be found in East Sooke Park (between Aldridge Point and Creke Point).


EARTHQUAKES

The 1872 Earthquake as recorded at Race Rocks by Mr .Argyle the Lightkeeper from:
The 1872 North Cascades Earthquake British Columbia Reporting Localities.

The 1872 North Cascades Earthquake British Columbia Reporting Localities.
The Metchosin volcanics are particularly unusual in that they are not only an emergent sequence with ocean-floor affinity (Muller.). but as we will demonstrate, they are also an example of low-titanium normal mid-oceanic ridge basaIts (low-Ti MORB-N).
METCHOSIN VOLCANIC: A LOW-TITANIUM EMERGENT SEAMOUNT
AT THE BASE OF THE CRESCENT TERRANE” (92~)
By Andree de Rosen-Spence and A.J. Sinclair
The University of British Columbia
Accretion-related metamorphism of the Metchosin Igneous Complex, southern Vancouver Island, British Columbia Sean Timpa, Kathryn M. Gillis, and Dante Canil


Tidal Currents and Current Measurement at Race Rocks

The current at Race Rocks had just changed to a flood – it would be getting up to 6 knots in a few hours, so it was probably at about 5 knots at this time.

currentnowsTidal Current Predictions for  Race Passage
Prediction: Graph 


Race Passage Current tables, 2021


ADCP6Along with the installation of the Tidal Current turbine,  an ADCP was installed to give real time profiles of the Currents at Race Rocks. See the attached file for the type of profile that was generated:Sample of the result of the data analysis at Site 1:


sw24mThe Creation of the Race Passage Current Tables


Map of Currents at Race Rocks from ADCP tests


awac2See the video on wave and current measurement using the Acoustic Wave and Current instrument.


waterpropertiesWater Properties in Juan de Fuca


cursymbField Lab on Current Studies using Drogues.


tomiondeck1stomiondeck1sOceanographic
Research on Mixing in upwellings
of Race Rocks


kallesKalle Kallestrom’s essay on The biotic associations on the Current meter Block


deweysStratified Tidal Flow over a Bump
Richard Dewey,et al–Interactions of stratified flow on an isolated topographic feature: a bump to the east of Race Rocks.


ebbs MATLAB charts of barotropic currents to the east of Race Rocks.


generators
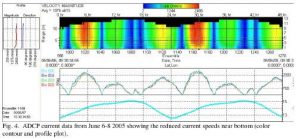
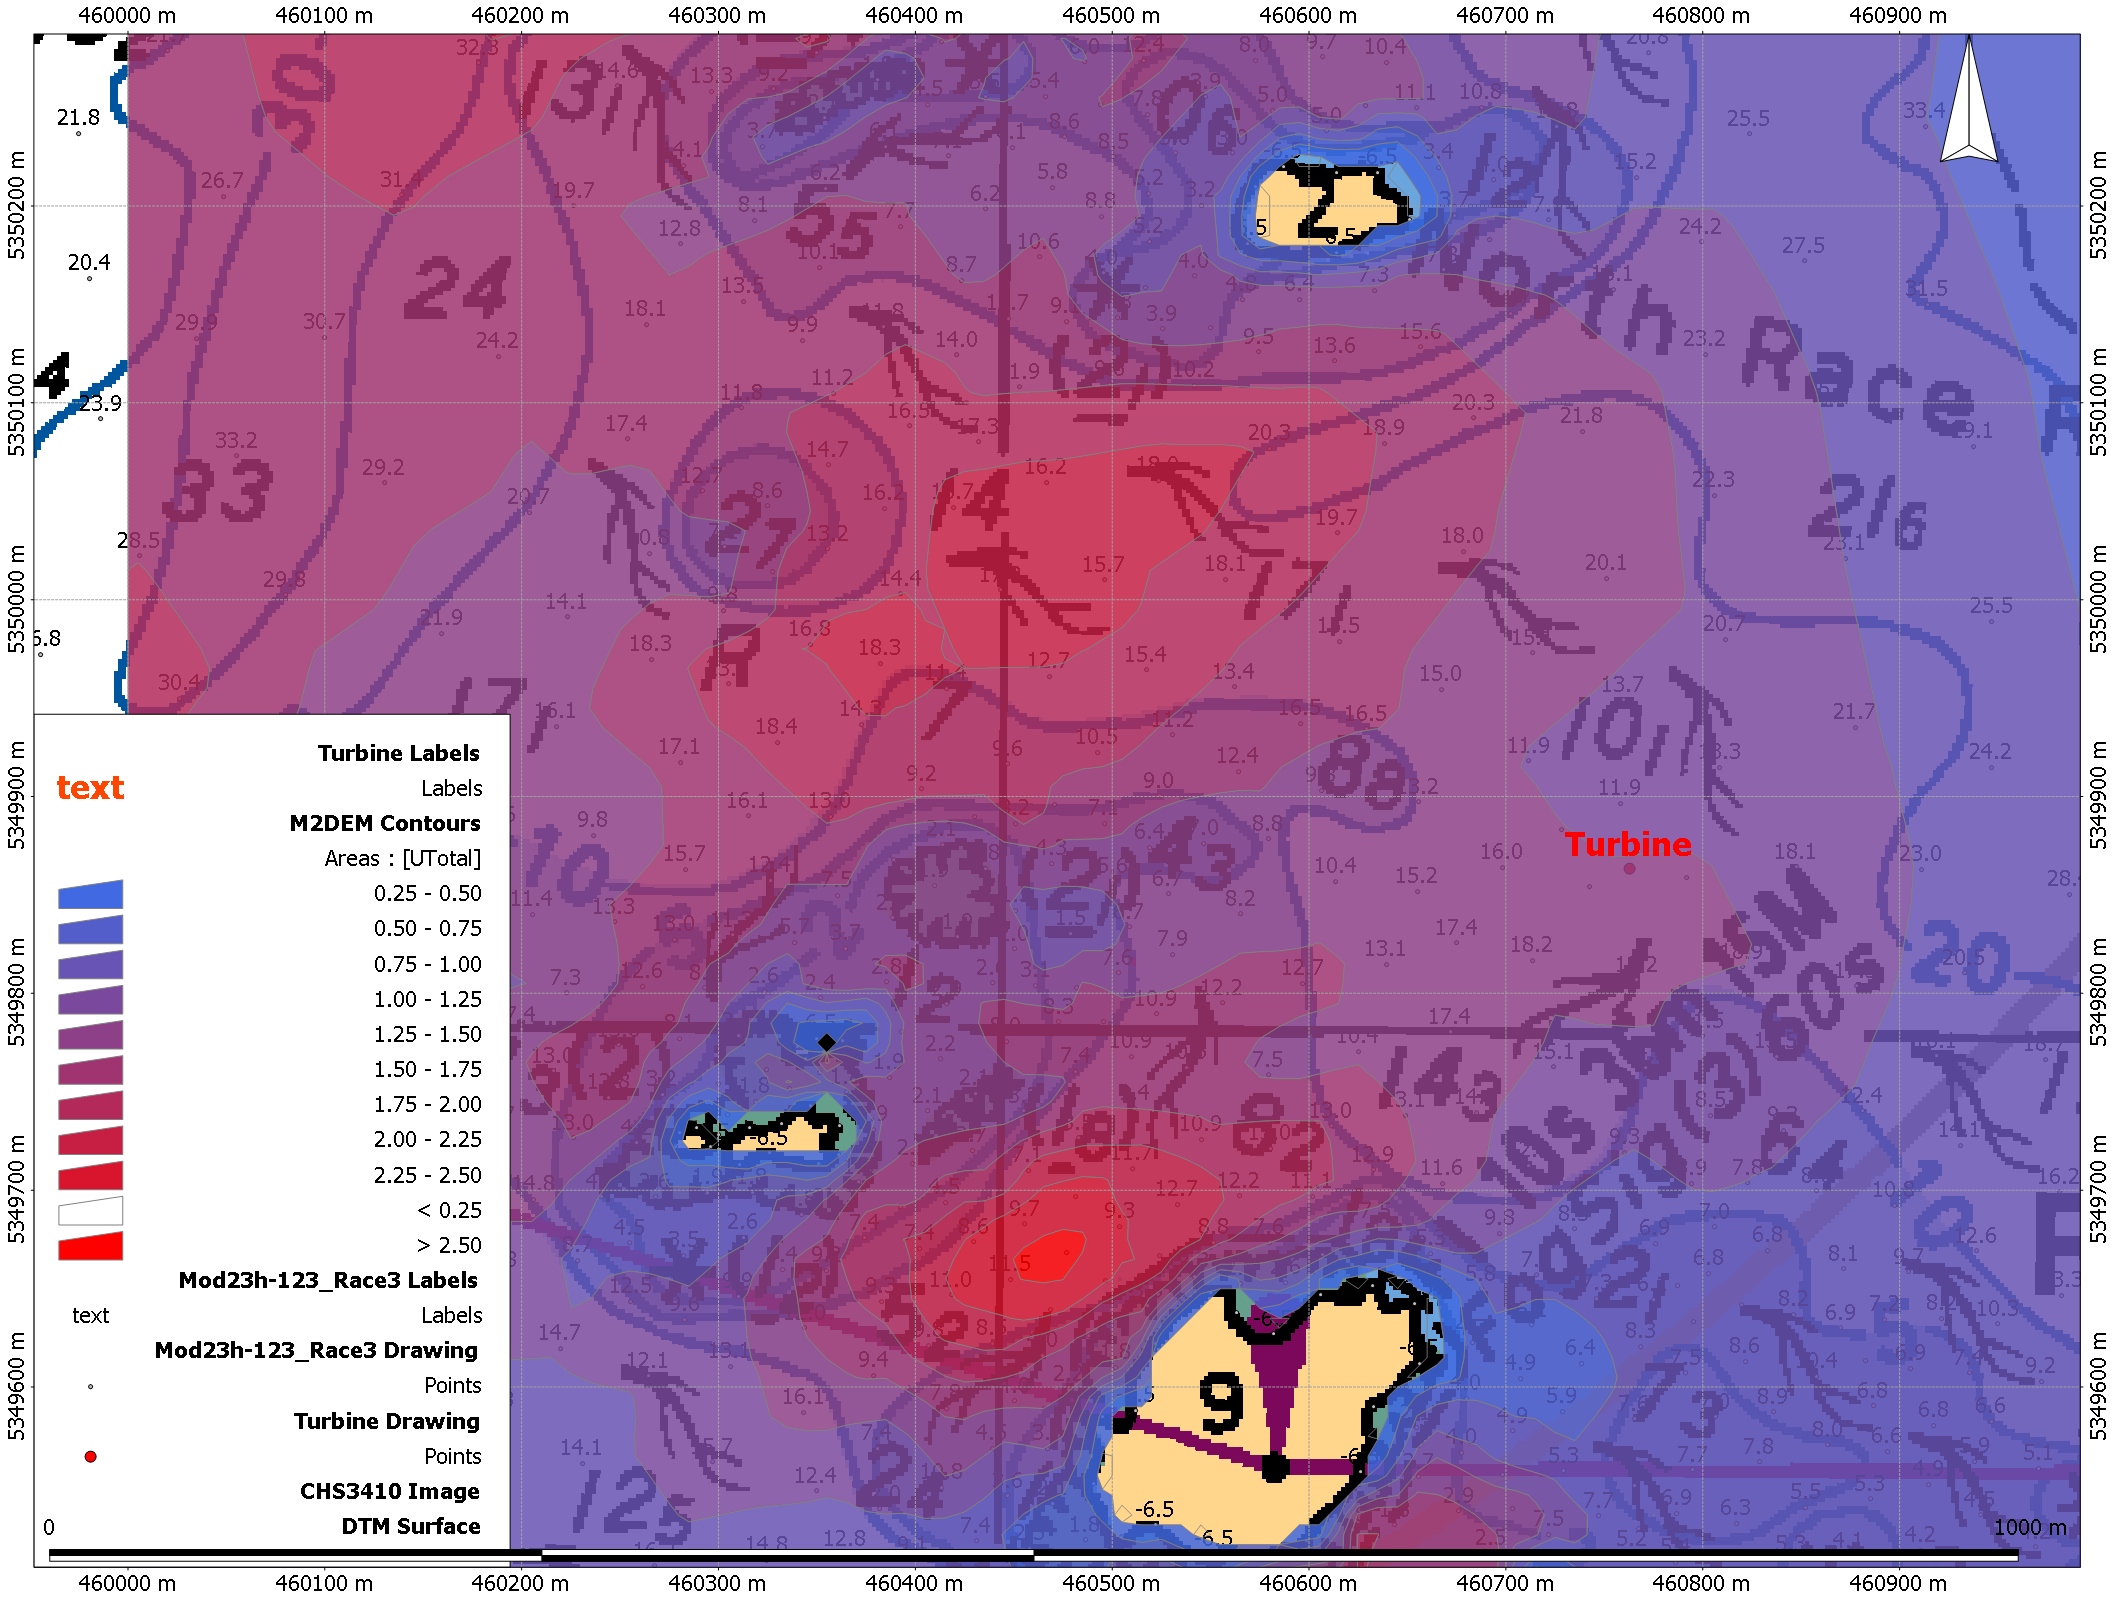
Link to the Tidal Current Power Project