 Prepared forDepartment of National Defence Prepared forDepartment of National DefenceCanadian Forces Base Esquimalt Victoria, BC & Public Works & Government Services Canada Pacific Region Victoria, BC Prepared by Mike W. Demarchi (M.Sc. R.P.Bio.) and Michael D. Bentley LGL Limited environmental research associates 9768 Second Street Sidney, BC V8L 3Y8
Cover photo: northern sea lions hauled out in Race Rocks Ecological Reserve, November 2003 EXECUTIVE SUMMARY On behalf of the Department of National Defence and Public Works & Government Services Canada, LGL Limited conducted a 14-month assessment of natural and human-caused factors with potential to affect key species of marine birds and pinnipeds at Race Rocks, British Columbia. This study had the following objectives:
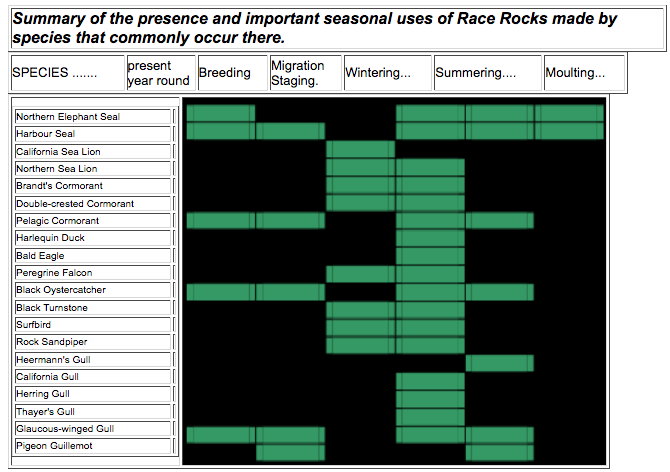
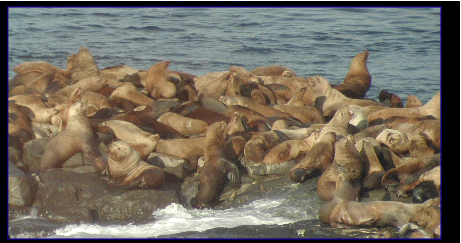
During 6 October 2002 through 27 November 2003, 52 monitoring sessions were conducted. Many different weather conditions, sea conditions, and human-caused disturbance events were observed. Tidal conditions changed considerably on hourly, daily and seasonal timescales. Animal distributions in the study area were very aggregated and showed clear patterns of seasonal variation. The Federal and Provincial status of key wildlife species, together with a brief species account of each were presented. Species that are common at Race Rocks use the area to fulfil life history needs including, non-breeding seasonal ranges, breeding habitat, migration/staging, and moulting. Important uses of the area by common species are summarized in the table below. Race Rocks provides highly suitable habitat, but with the possible exceptions of northern sea lions and black oystercatchers, the area is not likely providing any species with critical habitat (see page 55) at present. Northern elephant seals were the least abundant pinniped throughout the study. Maximum daily counts ranged from 0 in the late autumn to 22 in the spring. Harbour seals were the most abundant pinniped throughout the study. Maximum daily counts ranged from 0 in the winter to 667 in the summer. California sea lions were the third most abundant pinniped during study. Maximum daily counts ranged from 0 in the winter and summer to 244 in late summer. Northern sea lions were the second most abundant pinniped during the study. Maximum daily counts ranged from 0 in the summer to 555 in late autumn. Although the northern sea lion is Red Listed in British Columbia, all individuals that occur at Race Rocks are believed to be from the Eastern Stock. Whereas the Western Stock is listed as Endangered under the U.S. Marine Mammal Protection Act, the Eastern Stock is not.
Pedestrian-caused disturbances typically involved: intentional clearing northern elephant seals off the boat launch; incidental displacement of harbour seals, incidental displacement of California sea lions, and to a lesser extent, northern sea lions; and incidental displacement of gulls. Overflights by raptors such as bald eagles were the most consistent (93.7% of events recorded) disturbance that caused some animals (in this case, primarily gulls) to take flight or enter the water. Very low numbers of aircraft passed over or near the monitored area, causing little or no apparent disturbance to wildlife. The Coast Guard helicopter might be an exception. Kayakers were rare in the monitored area. Boats operated by LBPC were observed regularly throughout the monitored period, and together with the LGL boat, were the only boats to regularly dock at Race Rocks. LBPC and LGL boats displaced modest numbers of birds and pinnipeds from the dock area during most arrivals and departure. Pleasure boats were observed throughout the monitored period, mainly in summer. Harbour seals, sea lions, and cormorants, were all displaced by pleasure boaters. Some poaching of fish and shellfish occurs by recreational fishermen and recreational scuba divers, respectively. Ecotour boats constituted the greatest amount of boat traffic in the monitored area, with peak visitation rates during the height of the summer tourist season. Daily numbers of ecotour boats ranged from 0 to 43, with as many as nine present in the study area at the same time. Some ecotour boats were observed to displace harbour seals, sea lions, cormorants, and gulls, but most caused no observable effects. The fact that Race Rocks provides highly suitable habitat for marine birds and pinnipeds is indisputable. However, determining the extent to which Race Rocks provides important or critical habitat for any given species is not so straightforward. Northern Sea Lion (COSEWIC, Special Concern; Conservation Data Centre, Red Listed) is the only species that could be reasonably expected to pose any local conservation concerns at Race Rocks at present. The black oystercatcher (COSEWIC, Not Listed; Conservation Data Centre, Yellow Listed) might become a concern in the future at Race Rocks due to the relatively low number of breeding pairs in the province. Marine birds and pinnipeds at Race Rocks are exposed to a number of different disturbance stimuli that alter normal behaviour patterns. The fact that human activities disturb wildlife does not in itself provide a basis to ban such activities. Indeed, if that were the case, no people or boats would be permitted in the Race Rocks Ecological Reserve without authorization. If disturbances have no consequences for the population, or even if the population consequences are sustainable, restricting human activities for the sake of preventing disturbance is likely to have negative social and other consequences that are out of proportion to the impacts that are being avoided or mitigated. By increasing animal activity and displacing animals from the land to the air and water, humans exert adverse effects on marine birds and pinnipeds at Race Rocks. However, no significant adverse effects stemming from single or cumulative disturbance types on the regional populations of any species of marine bird or pinniped at Race Rocks Ecological Reserve are expected to presently originate in, or immediately adjacent to, the study area. ACKNOWLEDGEMENTS Many people assisted with this study. We especially thank Duane Freeman (Department of National Defence, CFB Esquimalt, Formation Environment) and Andrew Smith (Public Works and Government Services Canada) for their leadership and assistance in conducting this important research. Duane Freeman and Tracy Cornforth (Formation Environment) provided constructive reviews of draft of this report. Rae-Ann Shaw (Public Works and Government Services Canada) provided important administrative assistance. Duane Freeman and his department staff reviewed a draft of this report. PO Rob Cantwell, PO Chris MacDonald, and PO Oliver provided important logistic support concerning training activities on Bentinck Island and Whirl Bay. ESO Al Carter provided information concerning Christopher Point. Rik Simmons, Don McLaren, and Debbie McKinnon (Province of BC) assisted with research permitting. Captain Terry Weber and Vivian Skinner (Canadian Coast Guard) provided access to the light tower. Phil Emery (Canadian Coast Guard) coordinated a staged helicopter landing. Angus Matthews, Garry Fletcher, and Mike and Carol Slater (Pearson College) provided logistical support on Great Race Rock. Peter Olesiuk (Department of Fisheries and Oceans) provided some information on pinnipeds. Gary Searing of LGL provided important assistance with the study proposal and reviewed a draft of this report. Steve Johnson reviewed portions of a draft of this report. Dorothy Baker of LGL Limited proofed draft of this report. Mike Demarchi, Steve Johnson and Sonya Meier supervised field activities. Michael Bentley, Karen Truman, Lucia Ferreira, Jim Ferguson, Virgil Hawkes, Dave Robichaud, Jason Smith, Andrew Davis, and Philina English assisted with data collection. All photographs were taken by the senior author, except where noted. Suggested Citation: DEMARCHI, MW AND MD BENTLEY. 2004. Effects of natural and human-caused disturbances on marine birds and pinnipeds at Race Rocks, British Columbia. LGL Report EA1569. Prepared for Department of National Defence, Canadian Forces Base Esquimalt and Public Works and Government Services Canada. 103 p. EXECUTIVE SUMMARY……………………………………………………………………………………………….i ACKNOWLEDGEMENTS……………………………………………………………………………………………..v CONTENTS………………………………………………………………………………………………………………vi 1 INTRODUCTION………………………………………………………………………………………………………1 4 METHODS………………………………………………………………………………………………………………18 4.1 ANALYTICAL LIMITATIONS………………………………………………………………………………………19 . 4.2 DATA ANALYSES………………………………………………………………………………………………….20 5 RESULTS………………………………………………………………………………………………………………..20 5.1 CENSUS DATA………………………………………………………………………………………………………23 5.1.1 Cormorants………………………………………………………………………………………………………….25 5.1.2 Bald Eagle…………………………………………………………………………………………………………..26 5.1.3 Gulls………………………………………………………………………………………………………………….26 5.1.4 Northern Elephant Seal………………………………………………………………………………………….27 5.1.5 Harbour Seal………………………………………………………………………………………………………28 5.1.6 California Sea Lion……………………………………………………………………………………………….28 5.1.7 Northern Sea Lion………………………………………………………………………………………………..29 5.2 NATURAL AND HUMAN-CAUSED DISTURBANCES……………………………………………………….30 5.2.1 Effects of Disturbance on Animal Abundance from Morning to Afternoon……………………………30 5.2.1.1 Cormorants……………………………………………………………………………………………………….30 5.2.1.2 Gulls……………………………………………………………………………………………………………….30 5.2.1.3 Northern Elephant Seal……………………………………………………………………………………….32 5.2.1.4 Harbour Seal…………………………………………………………………………………………………….32 5.2.1.5 California Sea Lion……………………………………………………………………………………………..33 5.2.1.6 Northern Sea Lion……………………………………………………………………………………………….35 5.2.2 Effects of Discrete Disturbance Events on Animal Abundance and Behaviour..…………………….37 5.2.2.1 Effects on Harbour Seals……………………………………………………………………………………..40 5.2.2.2 Effects on California Sea Lions………………………………………………………………………………41 5.2.2.3 Effects on Northern Sea Lions………………………………………………………………………………..43 5.2.2.4 Disturbance by Killer Whales…………………………………………………………………………………45 5.2.2.5 Disturbance by Raptors………………………………………………………………………………………..45 5.2.2.6 Disturbance by Pedestrians and Domestic Animals…………………………………………………….46 5.2.2.7 Disturbance by Aircraft…………………………………………………………………………………………48 5.2.2.8 Disturbance by Boats…………………………………………………………………………………………..49 5.2.2.9 Disturbance by Blasting………………………………………………………………………………………..53 6 DISCUSSION..……………………………………………………………………………………………………………54 6.1 RELEVANT LEGISLATION…………………………………………………………………………………………54 6.2 USE OF RACE ROCKS BY MARINE BIRDS AND PINNIPEDS…………………………………………..55 6.2.1 Birds………………………………………………………………………………………………………………….56 6.2.2 Northern Elephant Seal…………………………………………………………………………………………..56 6.2.3 Harbour Seal………………………………………………………………………………………………………..56 6.2.4 California Sea Lion…………………………………………………………………………………………………57 6.2.5 Northern Sea Lion………………………………………………………………………………………………….58 6.3 EFFECTS OF NATURAL AND HUMAN-CAUSED DISTURBANCE……………………………………….58 6.3.1 Birds…………………………………………………………………………………………………………………..61 6.3.2 Northern Elephant Seal……………………………………………………………………………………………63 6.3.3 Harbour Seal…………………………………………………………………………………………………………63 6.3.4 California Sea Lion…………………………………………………………………………………………………..65 6.3.5 Northern Sea Lion……………………………………………………………………………………………………65 7 LITERATURE CITED……………………………………………………………………………………………………..69 . 8 APPENDICES..………………………………………………………………………………………………………….74 viii LIST OF TABLES…………………………………………………………………………………………………………..Page Table 1. Dates and active range status in WQ during 52 monitoring sessions at Race Rocks……………21 Table 2. Distribution (percent) of all observations of common species and groups in the Race Rocks study area during morning and afternoon censuses from October 2002 through November 2003……………………………………………………………………………………………………………………………..24 Table 3. Summary of the presence and important seasonal uses (shaded cells) of Race Rocks made by species that commonly occur there……………………………………………………………………………………………………….24 Table 4. Results of logistic regression analyses to detect the effect of, tide, swell height, and Bentinck Island demolitions on the relative change in numbers of animals in the Race Rocks census area in the afternoon versus morning periods from October 2002 through November 2003……………………………………………………………………………………………………………………………..31 Table 5. Results of logistic regression analyses to detect the effect of number of projects in a run, tide height, swell height, air temperature, wind speed, wind direction, sea state, cloud cover, precipitation class, and visibility class on animal displacement during demolition runs on Bentinck Island from October 2002 through November 200…31 Table 6. Results of one-way ANOVA tests* of pre-discrete disturbance activity levels by type of monitoring day regarding military training range activities…………………………………………………………………………………………….37 Table 7. Results of t-Tests for differences between mean daily activity levels of pinniped based on samples when no discrete disturbance stimulus was attributed to the sample during days when Bentinck Island was active compared to days when no blasting occurred there (refer to Table 1 for dates included)……………………………………….37 Table 8. Percent of potential disturbance events that caused birds to fly or birds/pinnipeds to enter Table 9. Minimum, maximum, mean and standard deviation of the daily frequency of selected disturbance events as observed during 52 monitoring sessions at Race Rocks, BC spanning the period October 2002 through ix LIST OF FIGURES Page Figure 1. Map of southern Vancouver Island and eastern Juan de Fuca Strait………………………….3 Figure 2. Map of Sub-Areas within the study area……………………………………………………………………..4 Figure 3. Map of southern Vancouver Island and vicinity, showing Rocky Point, Race Rocks Ecological Reserve (within 20-fathom contour), and Military Training Area WQ (within circle)…………………………………………………………………………………………………………………………….6 Figure 4. Predicted tide heights at William Head during the study period………………………………………..22 Figure 5. Daily differences in predicted tide heights at William Head during the study period……………….22 Figure 6. Total numbers of cormorants on land in Race Rocks Ecological Reserve on each of 2 daily censuses (1=morning; 2=afternoon ) as observed from atop the light tower……………………………………………………25 Figure 7. Total numbers of bald eagles on land in Race Rocks Ecological Reserve on each of 2 daily censuses (1=morning; 2=afternoon ) as observed from atop the light tower……………………………………………………26 Figure 8. Total numbers of gulls on land in Race Rocks Ecological Reserve on each of 2 daily censuses (1=morning; 2=afternoon ) as observed from atop the light tower……………………………………………………………………27 Figure 9. Total numbers of northern elephant seals hauled out in Race Rocks Ecological Reserve on each of 2 daily censuses (1=morning; 2=afternoon ) as observed from atop the light tower. ……………………………………………………………………………………………………………………………………..27 Figure 10. Total numbers of harbour seals hauled out in Race Rocks Ecological Reserve on each of 2 daily censuses (1=morning; 2=afternoon ) as observed from atop the light tower…………………………………………………….28 Figure 11. Total numbers of California sea lions hauled out in Race Rocks Ecological Reserve on each of 2 daily censuses (1=morning; 2=afternoon ) as observed from atop the light tower ………………………………………29 Figure 12. Total numbers of northern sea lions hauled out in Race Rocks Ecological Reserve on each of 2 daily censuses (1=morning; 2=afternoon ) as observed from atop the light tower……………………………………………………..29 Figure 13. Boxplot summaries of daily changes in the abundance of gulls when Bentinck Island was inactive and when blasting occurred there, grouped by net change in swell condition in the afternoon versus morning peri ……32 Figure 14. Boxplot summaries of daily changes in the abundance of harbour seals when Bentinck Island was inactive and when blasting occurred there, grouped by net change in tide height in the afternoon versus morning peri…..33 Figure 15. Boxplot summaries of daily changes in the abundance of California sea lions when Bentinck Island was inactive and when blasting occurred there, grouped by net change in swell condition in the afternoon versus morning period…35 Figure 16. Boxplot summaries of daily changes in the abundance of Northern sea lions when Bentinck Island was inactive and when blasting occurred there, grouped by net change in swell condition in the afternoon versus morning period…36 Figure 17. Stacked line (cumulative total) chart of potential disturbance events (i.e., raptor, boat, pedestrian, and air traffic) during 52 monitoring sessions in the Race Rocks study area of from 6 October 2002 through 27 November 2003…………………………………………………………………………………………………………………..39 Figure 18. Number of blasts that occurred during each of the 52 monitoring sessions in the Race Rocks study area of from 6 October 2002 through 27 November 2003………………………………………………………………………….39 Figure 19. Activity levels of harbour seals at Race Rocks expressed as the mean values observed for each disturbance class on days when no blasting occurred (“No Range”), days when blasting occurred on Bentinck Island (“Bentinck”), and days when blasting occurred in Whirl Bay (“Whirl Bay”) only…………………………………………………………..40 Figure 20. Comparative changes in numbers of harbour seals in monitored sub-areas for selected potential disturbance types…………………………………………………………………………………………………………………………………41 Figure 21. Activity levels of California sea lions at Race Rocks expressed as the mean values observed for each disturbance class on days when no blasting occurred (“No Range”), days when blasting occurred on Bentinck Island (“Bentinck”), and days when blasting occurred in Whirl Bay (“Whirl Bay”) only……………………………………..42 Figure 22. Comparative changes in numbers of California sea lions in selected monitored areas for selected potential disturbance types………………………………………………………………………………………………………………….43 Figure 23. Activity levels of northern sea lions at Race Rocks expressed as the mean values observed for each disturbance class on days when no blasting occurred (“No Range”), days when blasting occurred on Bentinck Island (“Bentinck”), and days when blasting occurred in Whirl Bay (“Whirl Bay”) only………………………………………44 Figure 24. Comparative changes in numbers of northern sea lions in selected monitored areas for selected potential disturbance types………………………………………………………………………………………………………………….45 Figure 25. Relative distribution of Lester B. Pearson College boats observed in Race Rocks Ecological Reserve during monitoring sessions from October 2002 through November 2003……………………………………………………….50 Figure 26. Relative distribution of pleasure boats observed in Race Rocks Ecological Reserve during monitoring sessions from October 2002 through November 2003………………………………………………………………………………….51 Figure 27. Relative distribution of ecotour boats observed in Race Rocks Ecological Reserve during monitoring sessions from October 2002 through November 2003………………………………………………………………………………….53 Figure 28. Conceptual model of the hierarchical effects of exposing a wildlife species to a non- directly lethal visual or aural disturbance stimulus……………………………………………………………………………………………………….61 LIST OF PHOTOS Page Photo 1. Aerial photo of Great Race Rock as viewed from the northwest………………………………..5 Photo 2. Adult glaucous-winged gull nesting on a grassy area of Great Race Rock………………………….12 Photo 3. Subadult male northern elephant seal………………………………………………………………………..13 Photo 4. Mother-pup pairs of harbour seals are commonly observed at Race Rocks during………………..14 Photo 5. Harbour seals haul out in abundance on intertidal portions of the study area………………………14 Photo 6. California sea lions hauled-out on Great Race Rock………………………………………………………15 Photo 7. Northern sea lions hauled out on Sub-Area 2-5 of Race Rocks…………………………………………16 Photo 8. Killer whales, such as this lone male, were infrequently observed in the study area. 7 August 2003….17 Photo 9. Example of tidal effect on the area of exposed land available for birds and pinnipeds……………. 23 Photo 10. Portion of a feeding flock of primarily gulls and cormorants, located approximately 2 km southeast of Race Rocks……………………………………………………………………………………………………………………………25 Photo 11. Example of how tide height affected haulout availability for harbour seals, including during the peak of their pupping season………………………………………………………………………………………………………………..34 Photo 12. An example of typical pinniped responses to blasting…………………………………………………..36 Photo 13. Raptors such as this adult bald eagle frequently disturbed cormorants and gulls in the study area…46 Photo 14. Students and staff from Lester B. Pearson College were frequent visitors to Great Race Rock…47 Photo 15. Approximately 200 harbour seals moved quickly from the shore of eastern Great Race Rock into the water immediately after being apparently startled by a high-pressure power washer being operated by a resident of the island………………………………………………………………………………………………………………………………47 Photo 16. Two tourists wander through an active glaucous-winged gull nesting area (Sub-Area H) on Great Race Rock; causing disturbance and risking egg destruction by trampling………………………………………………………..48 Photo 17. Most aircraft overflights did not cause animals to leave the rocks for the water or air. ……………49 Photo 18. Pleasure boat near a pod of killer whales moving north through Race Passage…………………….52 Photo 19. Ecotour boat traffic was common throughout the year, but particularly during summer. ………….52 LIST OF APPENDICES Page Appendix 1. Legislation with direct or potential relevance to marine life at Race Rocks.. ……………74 Appendix 2. Data collected during monitoring sessions at Race Rocks…………………………………………..85 Appendix 3. Methods used for the analysis of data collected during animal censuses and activity sampling in the Race Rocks study area………………………………………………………………………………………………………………87 Appendix 4. Total numbers of pinnipeds, gulls, cormorants, and shorebirds in Race Rocks Ecological Reserve as counted from atop the light tower during each of the two daily censuses for the monitoring period 6 October 2002 through 27 November 2003……………………………………………………………………………………………………………..91 Appendix 5. Total numbers of birds in Race Rocks Ecological Reserve as counted from atop the light tower during each of the two daily censuses for the monitoring period 6 October 2002 through 27 November 2003……………………………………………………………………………………………………………………………….94 Appendix 6. Total number of potential disturbance events recorded in the monitored area during each monitoring day at Race Rocks, BC. ……………………………………………………………………………………………………………..99 Appendix 7. Sample sizes used to calculate mean activity rates (proportion of animals with heads up) of three pinniped species at Race Rocks, BC as a function of whether or not a demolition range (i.e., Bentinck Island, or Whirl Bay) was active and according to individual disturbance stimuli (primary) or lack thereof (none)…………………………101 Appendix 8. All dates and approximatea number of projects detonated on Bentinck Island from 11 July 2002 (the most recent blasting prior to the onset of this study) through 30 November 2003………………………………………102 Appendix 9. Number of ordnances detonated at Christopher Point Ordnance Disposal Range during the study period of October 2002 through November 2003 by date, ordnance type, and individual weight………………………….103 Race Rocks is a provincial ecological reserve and has been proposed as a federal marine protected area. The area supports a diverse range of marine algae, marine invertebrates, fish, marine birds, and pinnipeds (seals and sea lions). Marine birds use Race Rocks for breeding and non-breeding purposes. Pinnipeds are of particular relevance to this study because they are large, conspicuous animals that have been the focus of concerns about the effects of local human disturbance. Harbour seals breed and haul out at Race Rocks, and northern elephant seals, California sea lions, and northern sea lions haul out there. Cetaceans transit the area intermittently. A major portion of Race Rocks Ecological Reserve is contained within the Department of National Defence’s (DND) Military Training Area WQ; however no training activities actually occur within the Reserve. The effects of the demolition training and ordnance disposal activities in WQ were first studied by LGL Limited during 1997 and 1998 (Demarchi et al. 1998). Results of that study indicated that some pinnipeds at Race Rocks responded to ordinance explosions by increasing their activity levels and moving from haulouts to the water. It was also noted that other human uses in the study area (e.g., whale watching boats, pleasure boats, human activity on Great Race Rock, etc.) elicited similar reactions from birds and pinnipeds. The initial study (Demarchi et al. 1998) was confined to a limited portion of the year and only on days when military exercises involving explosions occurred. Observations of the behavioural effects of non-military disturbances on marine life were opportunistically collected, but that study was not designed to assess impacts from non-military activities. The present study was designed to monitor the effects of natural environmental processes; military explosions; and non- military, human-caused (anthropogenic) disturbances on marine birds and pinnipeds at Race Rocks during a 14-month period. The diversity of marine life at Race Rocks makes it a popular location for boaters, divers, recreational adventurers, students, and researchers. These activities have the potential to disturb marine life. In addition, the absence of substantial human settlements in the area facilitates the regular use of high explosives by DND. It is important to recognize that military exercises represent one type of many potential disturbances that occurs locally. Therefore, it is important to try to assess the response of marine birds and pinnipeds to explosions independent of other impacts and the potential impacts of explosions in addition to all other impacts (i.e., the cumulative impacts). 1.1 Study Objectives This research focused on pinnipeds (seals and sea lions). However, selected species of marine birds were also monitored. This research was conducted under Park Use Permit #VI0210066. The objectives were to:
2 LGL Limited
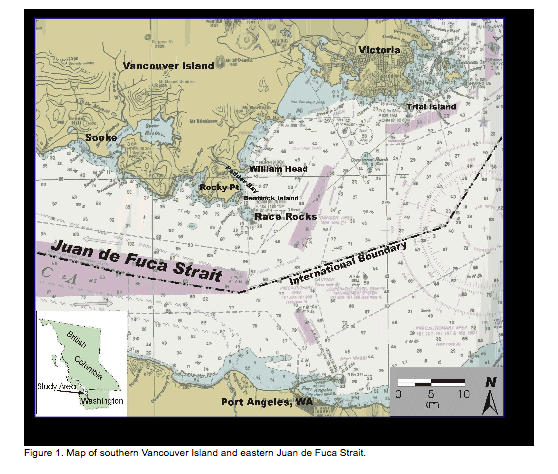
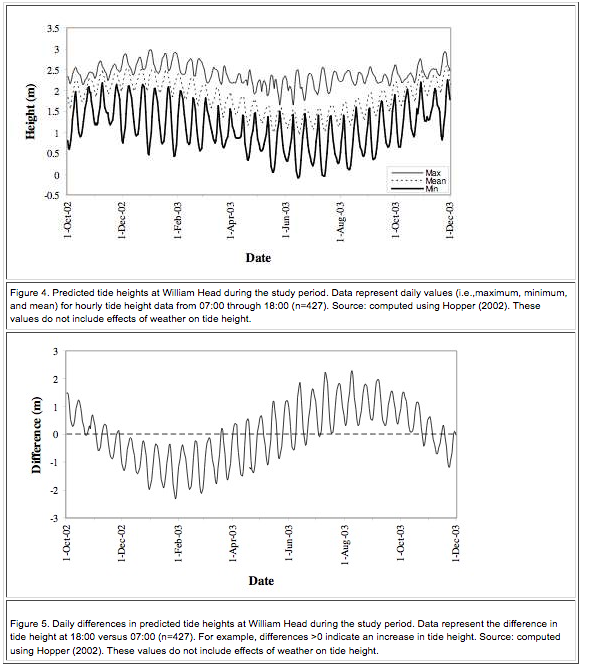
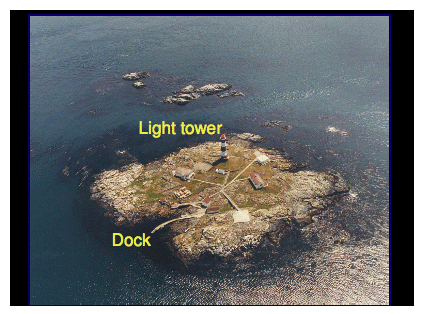
Marine birds and mammals at and near Race Rocks are subject to a number of different legislative acts and their corresponding regulations. A summary of relevant legislation is presented in Appendix 1. 3 STUDY AREA AND VICINITY 3.1 Race Rocks Ecological Reserve The study area is the exposed portion of Race Rocks Ecological Reserve, adjacent to Rocky Point on southern Vancouver Island (Figure 1; Figure 2). The Reserve is defined as the seabed and exposed land within the 20-fathom depth contour. Race Rocks is a complex composed of one island (Great Race Rock; 1.48 ha) and a number of smaller islets and reefs. Terrestrial vegetation occurs only on Great Race Rock, and consists of grasses and small forbs comprising both native and introduced species. Lester B. Pearson College of the Pacific (LBPC) operates several provincially owned buildings, including an ecoguardian (caretaker) residence, guest house, boat shed, tank room, crane shed, and diesel generator shed. Ancillary equipment operated by LBPC includes a concrete boat dock and launch, fixed crane, fuel pumping equipment, and diesel tanks. The Canadian Coast Guard leases a concrete helipad, light tower, and support infrastructure located on Great Race Rock (Photo 1). Great Race Rock was added to the Ecological Reserve in 2001. Race Rocks Ecological Reserve is in the eastern reaches of Juan de Fuca Strait in the Nanaimo Lowland Ecosection of the Eastern Vancouver Island Ecoregion of the Georgia Depression Ecoprovince (Demarchi et al. 1990). The climate of the study area is mild, being moderated by the Pacific Ocean. Tides are semidiurnal1 with strong diurnal inequality.2 Predicted values ranged from -0.11 to 3.06 m at William Head (located within 5 km north of Race Rocks) during the study period (Hopper 2002). Tidal flow through Race Passage can reach 7 knots. More comprehensive information on the biophysical features of Race Rocks Ecological Reserve can be found in Wright and Pringle (2001) and Province of BC (2002).
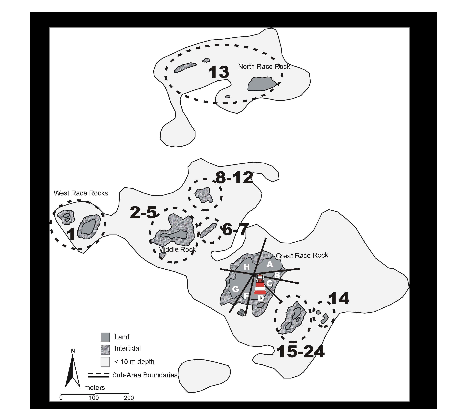
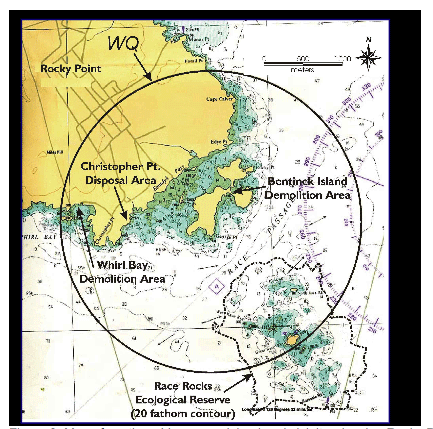
Figure 2. Map of Sub-Areas within the study area. Great Race Rock was divided into Sub-Areas A through H (excluding E, which was not designated). Outlying areas were initially assigned numbers for each discrete rock, but were subsequently grouped into areas that were usually contiguous or that appeared so from the light tower on Great Race Rock (also shown) . 3.2 Marine Training and Exercise Area WQ Canadian Forces Base (CFB) Esquimalt conducts military training in the use of explosives in Marine Training and Exercise Area WQ (“Whiskey Quebec”; Figure 3). WQ is located near Rocky Point on southern Vancouver Island, British Columbia and owned by the Federal Government, Department of National Defence. WQ is a circular range that covers 1075 ha of terrestrial and marine environments, and incorporates a portion of Race Rocks Ecological Reserve, although no military training occurs in the Reserve itself. Two ranges in WQ are used for training in ordnance-based demolitions: the Whirl Bay Underwater Demolition Range, and the Bentinck Island Demolition Range. Surplus and outdated ordnance is disposed in WQ by Canadian Forces Ammunition Depot (CFAD) Rocky Point at the Christopher Point Ordnance Disposal Range. Training activities in WQ are under the control of LGL Limited 5 Base Operations, CFB, Esquimalt. All training exercises in WQ must be approved by Base Operations as outlined in the CFB Esquimalt Range Standing Orders. Ordnance disposal activities are overseen by CFAD Rocky Point. Page 6:
Photo 1. Aerial photo of Great Race Rock as viewed from the northwest. Observations during this study were made from atop the light tower. Photo by Heath Moffat; used with permission from Lester B. Pearson College. The Whirl Bay Underwater Demolition Range is used primarily by Fleet Diving Unit (Pacific) (FDU(P)) for underwater demolitions and ordnance testing using charges of C4 plastique3 ranging from 0.5 to 10 kg. The part of Whirl Bay that is used for demolitions is a shallow (<15 m) cove approximately 300 m across and 190 m from the entrance to the demolition beach. The substrate of the cove consists of basaltic bedrock overlain by clay, mud, silt, and sand with several patches of kelp scattered over the bottom. Shoreline habitats consist of basaltic rock formations and pebbly and sandy beaches.
In October 2002, a bubble curtain was deployed in Whirl Bay as a means of attenuating the shock pulse of underwater detonations, and thereby reducing the adverse effects on underwater marine life. Prior to the actual demolitions, several “Thunderflashes” are detonated to scare marine life away from the blast area. The demolition area is >2 km from the nearest haulout in Race Rocks and is separated from Race Rocks by Christopher Point. Bentinck Island (31 ha) is separated from Rocky Point by Eemdyk Passage—a shallow channel that supports an abundance of bull kelp. Harbour seals are common in Eemdyk Passage, but other pinnipeds have not been seen there (pers. obs.). The mid-section of Bentinck Island is a low-lying, treeless area of pebble beaches connecting three larger areas which support stands of mature Douglas fir. The Bentinck Island Demolition Range is used primarily by Canadian Forces Fleet School (Seamanship Division) for above-water beach-clearing and obstacle-creation exercises involving metal cutting and the displacement and demolition of rocks and logs. The range is licensed for a maximum individual charge size of 2.3 kg (CFB Esquimalt Range Standing Orders). Petty Officer (PO) B. Phillips (pers. comm. 1996) indicated that in the past, the range has been typically used for 56 days per year, but demolitions do not occur on all such days. “Project” is the term used to describe an individual demolition (e.g., timber cut, steel cut, beach clearing, etc.) involving a single explosive charge. “Run” is the term used to describe a set of projects that are simultaneously set up by different teams of trainees. As of 1998, projects in the same run are detonated at a minimum interval of 2 minutes. There was no minimum interval between projects prior to 1998. During a typical day on which the range is active, two to four runs of one to three projects each (i.e., 4-12 blasts per day) are conducted. A typical project consists of one to four slabs4 of C4. Demolition training is conducted on the central beaches of Bentinck Island, with a line-of-sight to Race Rocks. The nearest haulout used by seals and sea lions in the Race Rocks Reserve is approximately 1.2 km away. Surplus ordnance is disposed by way of high-order5 detonation at the Christopher Point Demolition (disposal) Area. Disposal activities are conducted on an as-required basis, and unlike the other ranges in WQ, activities on the Christopher Point Range are not tied to training schedules. Under federal authorization, the disposal area is licensed for a maximum single explosive charge size of 13.6 kg. Twelve such charges are permitted per day. However, as a means of mitigating public concerns about blast noise, a voluntary reduction6 in maximum charge size to 6.8 kg was adopted in 1987 (Explosives Safety Officer [ESO] A. Carter, pers. comm. 1997). Use of the range varies greatly among years, but anywhere from one to 12 high- order detonations on up to 25 days (7%) of the year is a reasonable approximation (ESO A. Carter, pers. comm. 1997). The disposal site is situated in a clearing characterized by Scotch broom and mowed grass. The range has a line-of-sight to Race Rocks. The nearest haulout used by seals and sea lions in Race Rocks Ecological Reserve is approximately 2.0 km away. 3.3 Marine Life The marine habitats of southern Vancouver Island support a diverse array of invertebrates, fish, birds, and mammals. The terrestrial and marine habitats near Rocky Point are important breeding areas, summering areas, wintering areas, migration corridors, or staging areas for approximately 200 species of birds (Campbell et al. 1990a, b; 1997; 2001). The most conspicuous mammals are the pinnipeds (seals and sea lions). The harbour seal (Phoca vitulina) is the only pinniped species that breeds in the study area. The abundance of California sea lions (Zalophus californianus) and northern sea lions7 (Eumetopias jubatus) is greatest outside the May-July breeding season. Northern elephant seals (Mirounga angustirostris) have occurred at Race Rocks in recent years. Single northern fur seals (Callorhinus ursinus) have been reported, but sightings of this species are very infrequent. Cetaceans such as killer whales (Orcinus orca) and gray whales (Eschrichtius robustus) are occasionally observed in or near the study area, but do not occur there with the same predictability as pinnipeds. 4 A slab of C4 weights 0.500 kg 3.3.1 Injury and Disturbance Ecotourism is a thriving venture both worldwide and on southern Vancouver Island. The tourism industry in Victoria is significant to the local economy. Local entrepreneurs have been quick to capitalize on a large population of tourists and residents willing to pay to see whales and other marine mammals such as sea lions. Obee (1998) presents a general discussion of the rapid growth of this business and the negative effects it can have on local marine life. Wildlife viewing by the pleasure-boating general public can also disturb wildlife. Tershy et al. (1997) describe how humans affected a reserve used by marine birds and pinnipeds. As observed by Demarchi et al. (1998), ecotourism and other human activities at Race Rocks are capable of disturbing birds and pinnipeds. In terms of the responses by individual animals, such disturbances are comparable to those caused by blasts. However, when taken in the perspective of an entire year, disturbances by boats and humans could out-weigh disturbances caused by explosions because the former disturbances are more frequent. Whereas DND activities occur infrequently during the course of a year, boats and other human-caused disturbances occur almost daily when weather conditions are suitable. Disturbances of birds and pinnipeds by boats and human activities on Race Rocks can be viewed as cumulative impacts on the species in question. As reported by Demarchi et al. (1998), blasting often coincided with the presence of ecotourists and pleasure boaters. As recreational boat traffic at Race Rocks increases, the likelihood of such events coinciding is expected to increase. Consequently, an increase in the number of complaints to DND regarding the effects of blasting activities on marine mammals can be expected, 9 LGL Limited (sentence missing in original copy??) regardless of the degree to which any observed disturbances were caused or compounded by the presence of the boat and its occupants 8. 3.3.2 Species Accounts The Committee on the Status of Endangered Wildlife in Canada (COSEWIC) tracks the status of flora and fauna in Canada. Listing categories applicable to the species presented in this section are defined as:
In BC, flora and fauna are assessed for concerns about their conservation by the provincial Conservation Data Centre (CDC). Listing categories are as follows:
The following accounts describe selected bird and mammal species that occur at Race Rocks. Current COSEWIC listings are followed by current CDC listings. 3.3.2.1 Brandt’s Cormorant (Not Listed; Red Listed) Brandt’s cormorants are uncommon to abundant throughout south-coastal BC during the year. Several small breeding colonies exist in BC, and in 1987 three nests with young were found at Race Rocks (Campbell et al. 1990a). They are much more abundant near southern Vancouver Island from August to April (Gates 2001) when numerous birds arrive from breeding areas along the west coast of the United States. Brandt’s cormorants roost on Race Rocks and forage in the surrounding waters during autumn through spring. 3.3.2.2 Double-crested Cormorant (Not at Risk; Blue Listed) Double-crested cormorants are common residents of southern Vancouver Island, breeding mainly on islands in the Strait of Georgia (Gates 2001, Campbell et al. 1990a). The breeding population has been decreasing in BC in the last two decades (Fraser et al. 1999; Chatwin et al. 2002). Double-crested cormorants commonly rest on the Race Rocks islets and feed in the waters of the Ecological Reserve and surrounding area. The species is not known to breed at Race Rocks.
Editors note: We have linked some of the following species to the appropriate reference in the racerocks.com Taxonomy Files. That was not part of the original report. 3.3.2.3 Pelagic Cormorant (pelagicus subspecies Not Listed; Red Listed – resplendens subspecies Not Listed; Yellow Listed) Two subspecies of pelagic cormorant occur in BC and both may occur at Race Rocks. The pelagicus subspecies nests north of Vancouver Island and in Alaska and is Red-listed due to a decline in numbers. It may occur at Race Rocks occasionally during the non-breeding season. The resplendens subspecies breeds in south-coastal BC including Race Rocks (Vermeer et al. 1989a). The number of pelagic cormorants nesting on Race Rocks varies from year to year with 120 counted by Vermeer et al. (1989a) in 1987 and 0 in 2000 (Chatwin et al. 2002). Pelagic cormorants use the rocks and islets of Race Rocks throughout the year for resting and the surrounding waters for feeding. 3.3.2.4 Bald Eagle (Not at Risk; Yellow listed) Bald eagles are fairly common on southern Vancouver Island from September to mid-May. During the summer months many of them move north to areas where salmon are spawning and are uncommon locally during that time. Bald eagles usually build their nests in large trees close to water. They breed near Race Rocks along the shore of Vancouver Island, but not within Race Rocks Ecological Reserve. Bald eagles use Race Rocks Ecological Reserve mainly as a resting and feeding area where they forage on fish and gulls. 3.3.2.5 Peregrine Falcon (anatum subspecies Threatened; Red Listed – pealei subspecies Special Concern; Blue Listed) Three subspecies of peregrine falcons occur in BC. Although all three probably occur at Race Rocks occasionally, the most likely and frequent is probably the Peale’s peregrine falcon. Peregrine falcons breed in small numbers throughout south-coastal BC. Peregrine falcons from other areas of the west coast migrate through and/or winter in the study area. Peregrine falcons hunt their main prey (other birds) frequently in Race Rocks Ecological Reserve. At times they rest or consume prey on the terrestrial portions of the Reserve, frequently perching on man-made structures on Great Race Rock or on higher portions of the rocky shorelines. 3.3.2.6 Black Oystercatcher (Not Listed; Yellow Listed) Black oystercatchers are common residents and breeders at rocky coastal shoreline areas of southern Vancouver Island (Gates 2001). Three pairs were counted on the islets of Race Rocks in 1987 (Vermeer et al. 1989b). It is reported by LBPC that up to six pairs nest on the islets (Race Rocks 2003). During the non-breeding season up to 40 or more birds aggregate at Race Rocks. In winter during daylight (high tide) hours they spend much of their time on Race Rocks resting and preening. 3.3.2.7 Black Turnstone (Not Listed; Yellow Listed) Black turnstones are common at marine shoreline habitats on southern Vancouver Island from August to mid-April (Gates 2001). They prefer rocky coastlines and are commonly seen on Race Rock islets feeding and resting. 3.3.2.8 Surfbird (Not Listed; Yellow Listed) Surfbirds are present in small numbers on the marine shoreline habitats of southern Vancouver Island from late July to April. They do not breed in the study area (Gates 2001). Small numbers feed and rest on Race Rocks during that time, with peak numbers in spring and fall during migration. 3.3.2.9 Rock Sandpiper (Not Listed; Yellow Listed) Race Rocks is one of the best places to see rock sandpipers in the Victoria area. This species is quite rare in the region occurring almost exclusively on the rocky shores of offshore islands and islets. Rock sandpipers are regular in small numbers on Race Rocks from late October to late May. They do not breed in the study area. The islets of Race Rocks Ecological Reserve are used for resting during high tide and feeding during lower tides. 3.3.2.10 Heerman’s Gull (Not Listed; Yellow Listed) Heerman’s gulls are common in south coastal BC from mid-July to the end of October when most of their population moves north along the Pacific coast from their Mexican breeding grounds. They are very rare at other times of the year and do not breed in BC (Gates 2001, Campbell et al. 1990b). Hundreds of Heerman’s gulls use the islets of Race Rocks for resting and the surrounding waters for feeding during their time in this area. 3.3.2.11 California Gull (Not Listed; Blue Listed) California gulls are common to abundant during their spring (March-April) and fall (July- October) migrations in the southern Vancouver Island area. They are quite rare at most other times of the year and do not breed in the study area (Gates 2001). They commonly feed in the water surrounding Race Rocks and rest on the islets during their stay in the area. 3.3.2.12 Herring Gull (Not Listed; Yellow Listed) Herring gulls are uncommon at southern Vancouver Island from September to April and rare during the rest of the year. This species is mainly an offshore gull in BC. Race Rocks is probably one of the better places to observe this species near shore and small numbers use the islets for resting and the surrounding waters for feeding mainly during the winter. 3.3.2.13 Thayer’s Gull (Not Listed; Yellow Listed) Thayer’s gulls are common winter visitors at southern Vancouver Island from about mid- September to March. They are not present or are very rare in the area from April to mid- September and do not breed in the area (Gates 2001). Very large numbers of Thayer’s gulls use Race Rocks during the fall and winter, resting on the islets and feeding in the surrounding waters. 3.3.2.14 Western Gull (Not Listed; Yellow Listed) Western gulls are uncommon to rare during most of the year near southern Vancouver Island (Gates 2001). This species nests along the Pacific coast of North America from Washington to California. At the northern edge of their range, hybridization with glaucous-winged gulls is frequent resulting in many hybrid birds that are impossible to classify to one species. Gulls that appear to be of pure western gull stock are uncommon to rare at Race Rocks Ecological Reserve throughout the year. They join the mixed-species gull flocks either resting on the islets or feeding in the surrounding water. Some of the gulls nesting at Race Rocks are probably hybrids. 3.3.2.15 Glaucous-winged Gull (Not Listed; Yellow Listed) Glaucous-winged gulls are the only species of gull nesting at Race Rocks (Photo 2) with up to 424 nests counted in 1989 (Vermeer et al. 1992). They are common all year throughout the region and their numbers have increased dramatically in the last two decades. Other than as a nesting colony, Race Rocks Ecological Reserve is used all year for resting on the islets and feeding in the surrounding water. 3.3.2.16 Pigeon Guillemot (Not Listed; Yellow Listed) Pigeon Guillemots are the only species of alcid that nests at Race Rocks. They are in the area year-round, but only use the land in Race Rocks during spring and summer. This migratory species resides in rocky coastal areas, and prefers to forage in shallow, inshore waters. Pigeon guillemots nest in rock crevices on the periphery of Great Race Rock. The first nesting record was in 1953 and published numbers of breeding pairs there range from 14 to 400 (Campbell et al. 1990b).
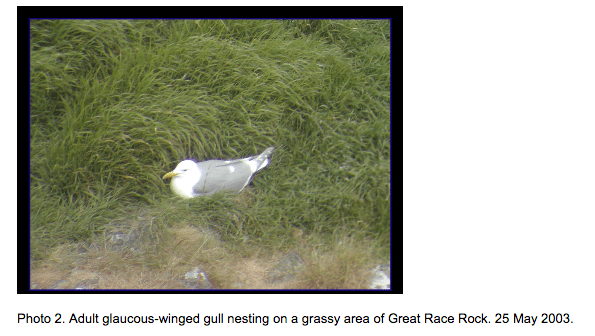
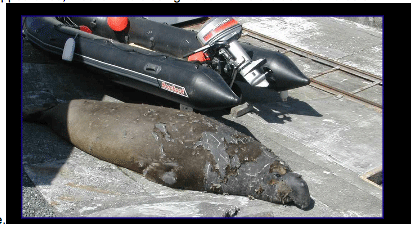
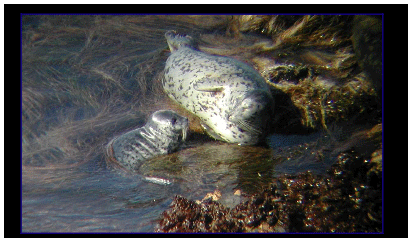
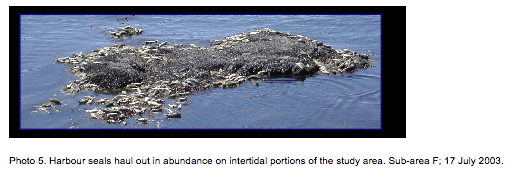
Photo 2. Adult glaucous-winged gull nesting on a grassy area of Great Race Rock. 25 May 2003. LGL Limited 13 3.3.2.17 Northern Elephant Seal (Not at Risk; Yellow Listed) The northern elephant seal (Photo 3) is a member of the family Phocidae—the true seals. Although near extinction at the beginning of the 20th century, legal protection of the species and its habitat has allowed it to recover. In 1991 there was an estimated population of 127,000 animals (Stewart and Huber 1993). This species is highly migratory, breeding primarily on islands in northern Mexico and central California and moving north after the breeding season. After breeding, most animals stay far offshore in deep water. Males move over the continental shelf as far north as the Gulf of Alaska and Aleutian Islands, while females tend to move westward into the open ocean (Stewart and Huber 1993). Northern elephant seals can haul out at any time of the year, but Stewart and Huber (1993) note three seasonal peaks in abundance at haulouts. The first is in winter during the combined pupping and breeding season. The second is in late April and early May when adult females and subadults come ashore to moult. The third is in October when non-pregnant females, pups, yearlings, and subadults come ashore to moult. Baird (1990) reported that northern elephant seals are sparsely, but widely distributed in British Columbian waters throughout the year and are usually seen singly. Race Rocks is one of the few spots in BC where elephant seals regularly haul out. The account by Cowan and Carl (1945) suggests that, at least up to the mid-20th century, northern elephant seals were not as common in BC as they are at present. Based on their size and general appearance, most animals using Race Rocks are adult females or subadults, although a few adult males also haul out there. Photo 3. Subadult male northern elephant seal. Members of this species commonly hauled-out on and near the boat launch at Great Race Rock. They tolerated humans at very close distances, to the point of becoming a nuisance at times as they interfered with boat launchings and landings. This individual is moulting its brown fur, exposing its grey, scarred skin beneath. 26 June 2003. 3.3.2.18 Harbour Seal (Not at Risk; Yellow Listed) The harbour seal (Photo 4; Photo 5) is a member of the family, Phocidae—the true seals. They are the most abundant and widespread pinniped in coastal waters of southern BC and the only one that breeds in the study area. They are non-migratory residents at Race Rocks and give birth (“pup”) on the islets. The pupping season of harbour seals varies regionally, with those in the study area giving birth during the months of June through September; peaking in late July (Bigg 1969). Harbour seal pups are highly precocial at birth and are reared in the water as well as on land (Riedman 1990). Pups are weaned at an age of 5-6 weeks. Harbour seals spend a considerable amount of time hauled-out on beaches, rocks, man-made structures, and islets, including the islets at Race Rocks. Numbers of harbour seals have increased dramatically in and near British Columbian waters after the species was afforded protection from hunting under Canadian and American laws (Olesiuk et al. 1990; Jeffries et al. 2003) . Photo 4. Mother-pup pairs of harbour seals are commonly observed at Race Rocks during summer. The species is present at Race Rocks year-round. Sub-Area G; 17 July 2003. LGL Limited 15 3.3.2.19 California Sea Lion (Not at Risk; Yellow Listed) The California sea lion (Photo 6) is a member of the eared seal family, Otariidae. California sea lions move north into the study area from breeding colonies in Mexico and California after each summer breeding season, then return south in the late winter and spring. Peak abundance in BC is between September and May. Most of the animals in BC are adult and subadult males but females are known to occur. The number of California sea lions using British Columbian coastal waters has increased substantially during the last century, and in particular, since 1980 (Bigg 1988a). Bigg (1988a) reported that California sea lions were not present on Race Rocks prior to 1965. Records from 1971 (summarized in Bigg 1988a) indicate a maximum of approximately 30 animals at Race Rocks. Since then, numbers have increased to several hundred animals at times. P. Olesiuk (pers. comm. 2002) indicated that California sea lions are expanding their non- breeding range northward within BC, but that little is known of this expansion due to limited monitoring of pinnipeds. In recent years there has been a continued northward expansion of the species on both the east and west coasts of Vancouver Island (P. Olesiuk, pers. comm. 2002). A few radio tags deployed on California sea lions in the early 1990s revealed that while in BC waters, California sea lions are very mobile and do not remain in the same area (haulout) for extended periods (P. Olesiuk pers. comm. 2002). In BC, California sea lions appear to readily and rapidly shift their distributions in response to the movements of their main prey, salmon and herring (P. Olesiuk pers. comm. 2002). A northward shift in schools of adult herring during the mid-winter pre- spawning period has resulted in a concomitant shift in California sea lions. For example, they no longer occur in the same abundance at Harmac (near Nanaimo) as in the past, but greater numbers are now seen near Hornby Island to the north (P. Olesiuk pers. comm. 2002).
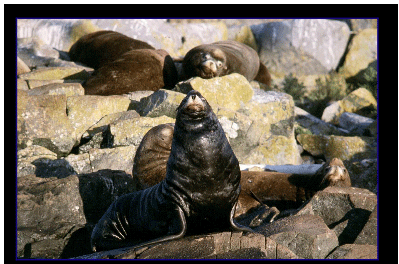
Photo 6. California sea lions hauled-out on Great Race Rock. The vast majority of California sea lions at Race Rocks are adult and subadult males. October 2002; (Photo: M. Bentley). 3.3.2.20 Northern Sea Lion (Special Concern; Red Listed) The northern sea lion (Photo 7) is a member of family Otariidae (eared seals). The breeding range of this species is from California, along the Pacific coast to Alaska and northeast Asia. Two stocks are recognized: the Western Stock which ranges from Russia to the Gulf of Alaska; and an Eastern Stock which ranges from southeast Alaska to California. In BC between 1912 and 1968, thousands of northern sea lions were killed in a campaign to reduce the perceived conflict between this species and commercial fishermen. A review of historic data (Bigg 1988b) indicated that control programs and commercial harvests conducted in BC during 1912-1967 eradicated one breeding area and reduced numbers on the remaining rookeries to about 25-30% of peak levels observed in the early 20th century, prior to any large-scale culls. Numbers of northern sea lions on Race Rocks appear to have rebounded since the control program ended (Bigg 1988b). Presently there is considerable concern about conservation of the western stock because of a dramatic, unexplained decline since 1970 (Trites and Donnelly 2003). Conversely, the Eastern Stock (the one which occurs at Race Rocks) has exhibited a modest increase during this period (Bigg 1988a; Calkins et al. 1999). Despite this increase, in November 2003 COSEWIC upgraded this species’ listing from “Not at Risk” to “Special Concern” because there are only three breeding locations in BC, the species is sensitive to human disturbance while on land, the threat of acute oil spills, and unexplained declines in other populations to the north and west of BC . The closest rookeries to Race Rocks are on the Scott Islands off northern Vancouver Island (Bigg 1988b; Loughlin et al. 1984). Northern sea lions migrate into the study area where they spend a considerable amount of time hauled-out on traditional beaches, rocks, and islets. Bigg (1988b) identified Race Rocks as a haulout site used by northern sea lions during their nonbreeding season, with peak abundance occurring during September through May. All sexes and age-classes (except newborn pups) of northern sea lions occur on Race Rocks.
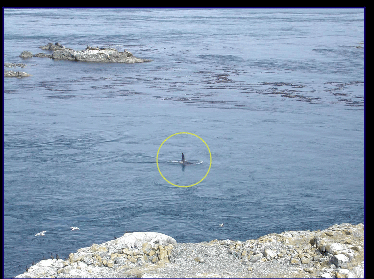
Photo 7. Northern sea lions hauled out on Sub-Area 2-5 of Race Rocks. That area was commonly used by both sexes and all age classes. Photo date: 20 November 2003. 3.3.2.21 Killer Whale (Northeast Pacific Southern Resident population: Endangered, Red Listed – Northeast Pacific Transient population: Threatened, Red Listed) Killer whales (Photo 8) are large members of the family Delphinidae that occur in arctic, temperate, and tropical waters of the world’s oceans. Two different populations occur in and near the study area: residents (which typically forage on fish—namely salmon) and transients (which typically forage on pinnipeds). The terms resident and transient do not accurately denote the movement patterns of each population (references in Baird 2001b) and members of either population can occur in the study area at any time of the year. They are infrequent visitors to Race Rocks Ecological Reserve, seldom spending more than a few minutes in it when they do occur there (this study). Baird and Dill (1994, cited in Calambokidis and Baird 1994) reported that killer whales take “large numbers’ of harbour seals at Race Rocks, but such behaviour was never observed during the present study or that by Demarchi et al. (1998) . Since 1960, the Southern Resident population of about 96 in 1967, declined to a low of 67 in 1971, then rose to about 100 individuals in 1995 (Baird 2001b). By 2001 the population had declined to 789, qualifying it as an endangered and “depleted stock” under the U.S. Marine Mammal Protection Act (Krahn et al. 2002). Much less is known of the local transient population.
Photo 8. Killer whales, such as this lone male, were infrequently observed in the study area. 7 August 2003. The methodology employed in this study was based on that used during a similar study conducted in 1997 and 1998 (Demarchi et al. 1998). Race Rocks was accessed by an inflatable boat launched from Rocky Point. Monitoring days were selected to represent a sample of weekday and weekend conditions. Two or three observers recorded data in four different Microsoft Access 2002 databases using a hand-held Comapq iPAQ computer running Visual CE v6.1. Binoculars (8-10x) and tripod-mounted spotting scopes (20-60x) were used to assist with animal identification. In addition to the information presented below, additional information on data collection is presented in Appendix 2. The first database concerned weather. Weather conditions were measured using on-site meteorological equipment (windspeed in knots and direction in degrees off true north) operated by the Coast Guard or by visual estimates (all others). As animal responses to disturbance may vary with time of day, cloud cover, wind speed, wind direction, wave height, swell condition, and tide height, weather parameters were measured in the morning and at the end of the day, and whenever notable changes in conditions occurred throughout the day. Tidal data were obtained for William Head (123° 32.0′ W, 48° 20.0′ N) using the computer program WXtide32 v2.7 (Hopper 2002). William Head is within 5 km to the north of Race Rocks. The second database contained counts of bird and pinniped species in the study area. Those data provided information on how numbers of animals in the study area changed during daily and seasonal timescales. Birds and pinnipeds were censused twice (morning and afternoon). Only animals that were supported by terrestrial features (i.e., islands, islets, rocks, man-made structures, etc.) within one of the sub-areas (see Figure 2) were counted because of the difficulties in seeing animals in the water or counting birds in the air. Further, only animals visible from the tower were counted. Some animals were hidden from view, but in our opinion, based on our familiarity with the study area viewed from different boat-based vantages, the vast majority (>90%) of individuals were visible from the tower. Densely crowded pinnipeds also obscured the view of some animals. Considering these visibility biases, counts were likely lower than the actual number of animals within the Reserve. The third database involved sweep counts of the numbers and behaviours of animals in selected sub-areas. These data facilitated an assessment of the effects of disturbance on bird and on pinniped behaviour and numbers by facilitating comparisons between pre- and post-disturbance conditions. These counts were made approximately every 30-60 minutes during the observation period, together with additional counts made immediately prior to, and within a few minutes following, blasting or the closest approach by people, boats, or aircraft. Two visible measures of disturbance are: 1) the change in body position (i.e., activity level; head-down or head-up of pinnipeds10), and 2) the change in numbers of pinnipeds on the haulouts and birds on hard surfaces. During samples of activity levels, we noted whether a disturbance stimulus was present or had occurred (e.g., if an ecotour boat was situated such that the passengers were focusing on the animals in the selected sub-area; or if a blast had just occurred). Multiple stimuli were recorded if they occurred simultaneously. Observations on the visible effects (or lack thereof) of a given stimulus were also noted as comments for each record. 10 It is acknowledged that sea lions sometimes rest in a head-up position, but in our experience at Race Rocks, the proportion of such animals is in the vast minority. The fourth database tracked potential disturbance events. Because the nature of disturbances from sources other than blasting by DND were unpredictable both spatially and temporally, it was important to track such disturbances in the vicinity of marine animals. To that end, a 250 m by 250 m grid was superimposed on a map of the study area. Grid cells entered by each disturbance stimuli were recorded, as well as the time at which the disturbance entered and left the study area. Cells were recorded a maximum of one time per individual disturbance factor even if the factor temporarily left then re-entered the same cell. Field sampling began 6 October 2002 and ended 27 November 2003. Where possible, days were scheduled to coincide with explosive training or demolition activities by DND. The dates and exact timing of explosions were coordinated with DND personnel. Up-to-the-minute reports on blast activities were monitored via VHF radio or cellular phone. “Non-training” days were scheduled to document responses to other sources of disturbance such as whale watching tours, pleasure craft, recreational dive boats, aircraft, and other types of human disturbance. 4.1 Analytical Limitations Data analyses are complicated by several factors with implications for the application of statistical inference to the study’s results:
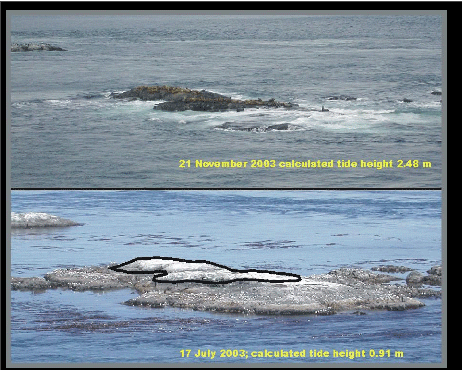
4.2 Data Analyses Detailed descriptions of analyses based on census and activity sample data are presented in Appendix 3. During the period 6 October 2002 through 27 November 2003, 52 monitoring sessions were conducted (Table 1). With the exception of two full days and one partial day when fog precluded accurate counts, monitoring was conducted as planned. On two other occasions, the trip to Race Rocks was cancelled due to extreme weather conditions. A wide range of weather conditions occurred during monitoring sessions, from sunny and clear to gale- and storm-force winds and rain storms. Observations were made under a wide range of tide heights and swell conditions. Although much of the land in the Race Rocks complex is exposed at even the highest tides, the amount of exposed land available for resting birds and pinnipeds varied considerably as a function of tide height. Note that no attempt was made to quantify the total area available for resting at any given time. A strong seasonal pattern was observed for tide heights and daily timing, both as observed in the field and as calculated (Hopper 2002). The highest tides were observed during monitoring sessions in November through March (Figure 4). Storms were also more common at that time of year, causing swells and wind-waves that further decreased the availability of resting areas or shortened the duration intertidal areas were exposed during the day (Photo 9). The November-March period was also characterized by a tendency for tides in the late afternoon (near the time when the second daily census was conducted) to be lower than those in the morning (when the first daily census was conducted; Figure 5). The remainder of the year followed the opposite pattern. Tidal variation measured on an hourly scale was sufficient to strongly affect the availability of land for resting birds and pinnipeds—especially harbour seals. Other pinnipeds were not so visibly affected. Table 1. Dates and active range status in WQ during 52 monitoring sessions at Race Rocks. For a summary of dates when the Bentinck Island range was active refer to Appendix 8. |
|||||||||||||||||||||||||||||||||||||||||||||||||||||||||||||||||||||||||||||||||||||||||||||||||||||||||||||||||||||||||||||||||||||||||||||||||||||||||||||||||
|
|||||||||||||||||||||||||||||||||||||||||||||||||||||||||||||||||||||||||||||||||||||||||||||||||||||||||||||||||||||||||||||||||||||||||||||||||||||||||||||||||
| a. Days when no blasting occurred as used for comparative purposes to days when blasting occurred on at least Bentinck Island b. Thick fog precluded complete censuses in both morning and afternoon c. Thick fog precluded a census in the afternoon |
|||||||||||||||||||||||||||||||||||||||||||||||||||||||||||||||||||||||||||||||||||||||||||||||||||||||||||||||||||||||||||||||||||||||||||||||||||||||||||||||||
|
|||||||||||||||||||||||||||||||||||||||||||||||||||||||||||||||||||||||||||||||||||||||||||||||||||||||||||||||||||||||||||||||||||||||||||||||||||||||||||||||||